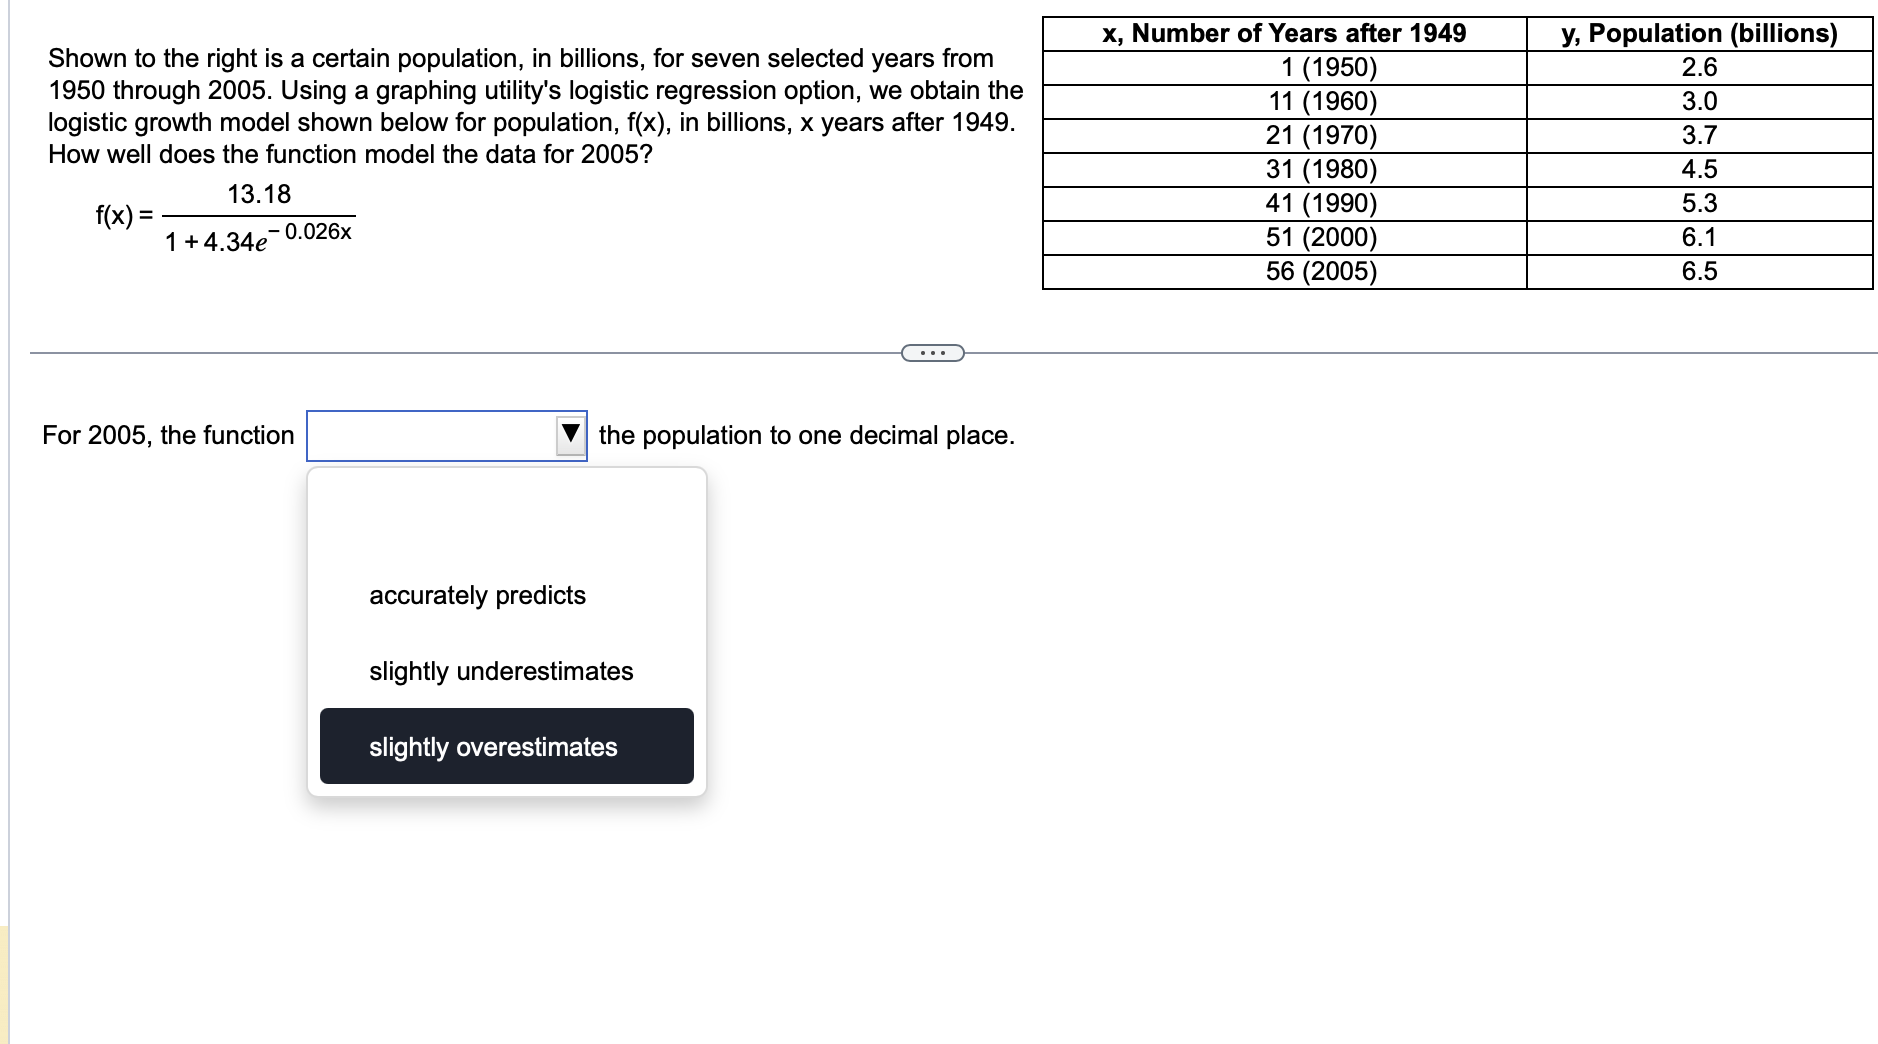
Question: the answer Shown to the right is a certain population, in billions, for seven selected years from 1950 through 2005. Using a graphing utility's logistic

the answer

the answer Shown to the right is a certain
Shown to the right is a certain population, in billions, for seven selected years from 1950 through 2005. Using a graphing utility's logistic regression option, we obtain the logistic growth model shown below for population, f(x), in billions, x years after 1949. How well does the function model the data for 2005? 13.18 f(x) = 1 +4.34e7 9.026x = For 2005, the function [| the population to one decimal place. accurately predicts slightly underestimates slightly overestimates x, Number of Years after 1949 y, Population (billions) 1 (1950) 2.6 11 (1960) 3.0 21 (1970) 3.7 31 (1980) 45 41 (1990) 53 51 (2000) 6.1 56 (2005) 6.5

Step by Step Solution

There are 3 Steps involved in it

1 Expert Approved Answer
Step: 1 Unlock blur-text-image
Question Has Been Solved by an Expert!

Get step-by-step solutions from verified subject matter experts

Step: 2 Unlock
Step: 3 Unlock

Students Have Also Explored These Related Accounting Questions!