

Question: The answer to this question is E. But I do not understand how it is E, could you explain why E is correct and D
The answer to this question is E. But I do not understand how it is E, could you explain why E is correct and D is incorrect?
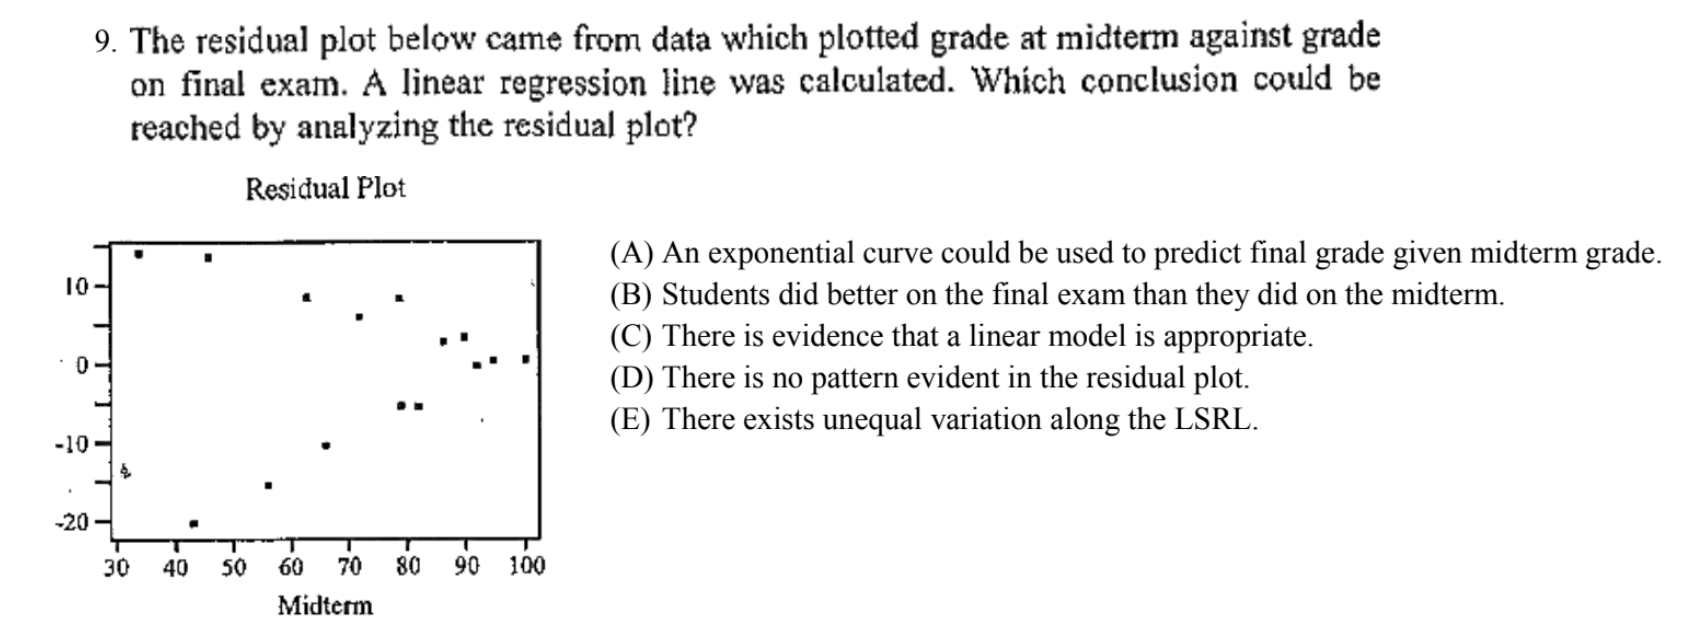
9. The residual plot below came from data which plotted grade at midterm against grade on final exam. A linear regression line was calculated. Which conclusion could be reached by analyzing the residual plot? Residual Plot 10 (A) An exponential curve could be used to predict final grade given midterm grade. (B) Students did better on the final exam than they did on the midterm. 0 - (C) There is evidence that a linear model is appropriate. (D) There is no pattern evident in the residual plot. -10 - (E) There exists unequal variation along the LSRL. -20 30 40 50 60 70 80 90 100 Midterm
Step by Step Solution
There are 3 Steps involved in it

Get step-by-step solutions from verified subject matter experts