

Question: the answers for the mutliple choice questions are the same. the top 2 pictures are the table you have to pull up. please help Upper
the answers for the mutliple choice questions are the same. the top 2 pictures are the table you have to pull up. please help 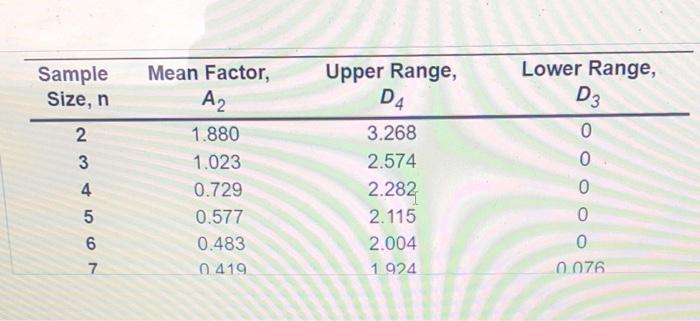
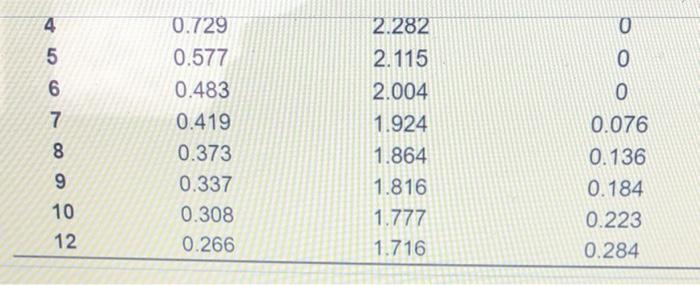
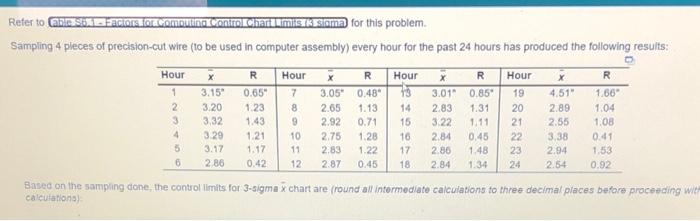
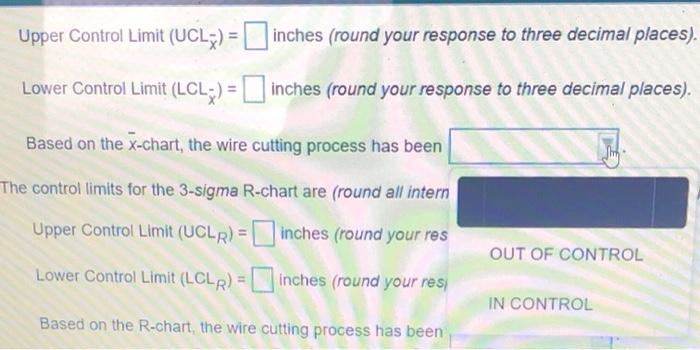
Upper Range, Sample Size, n Mean Factor, A D4 Lower Range, D3 0 0 4 5 6 1.880 1.023 0.729 0.577 0.483 0.419 3.268 2.574 2.282 2.115 2.004 1924 0 0 0 0076 0 6 7 0.729 0.577 0.483 0.419 0.373 0.337 0.308 0.266 2.282 2.115 2.004 1.924 1.864 1.816 1.777 1.716 8 0.076 0.136 0.184 0.223 0.284 9 10 12 Refer to Cable Ste Factor for computing Control Chart Limits i sioma for this problem. Sampling 4 pieces of precision-cut wire (to be used in computer assembly) every hour for the past 24 hours has produced the following results: Hour R Hour X R R 7 0.859 1.66" 8 1.31 1.04 Hour 1 2 3 4 5 6 X 3.15" 3.20 3.32 3.29 3.17 2 86 R 0.65" 1.23 1.43 1.21 1.17 0.42 9 10 11 12 3.05" 2.65 2.92 2.75 2.83 2.87 0.48" 1.13 0.71 1.28 1.22 0.45 13 14 15 16 17 18 3.01 2.83 3.22 2.84 2.80 2.84 1.11 0.45 1:48 1.34 Hour 19 20 21 22 23 24 X 4.51" 2.89 2.55 3.38 2.94 2.54 1:08 0.41 1.53 0.92 Based on the sampling done, the controllimits for 3-sigmax chart are (round all intermediate calculations to three decimal places before proceeding with calculations Upper Control Limit (UCL;) - inches (round your response to three decimal places). Lower Control Limit (LCL;) - inches (round your response to three decimal places). Based on the x-chart, the wire cutting process has been The control limits for the 3-sigma R-chart are (round all intern Upper Control Limit (UCLR) = inches (round your res OUT OF CONTROL Lower Control Limit (LCLR) = inches (round your res IN CONTROL Based on the R-chart, the wire cutting process has been
Step by Step Solution
There are 3 Steps involved in it
1 Expert Approved Answer
Step: 1 Unlock

Question Has Been Solved by an Expert!
Get step-by-step solutions from verified subject matter experts
Step: 2 Unlock
Step: 3 Unlock