

Question: The Apple worksheet in the data pack represents global revenue (measured in billions of dollars) generated by Apple from Q1-2016 to Q4-2021.- a. Construct a
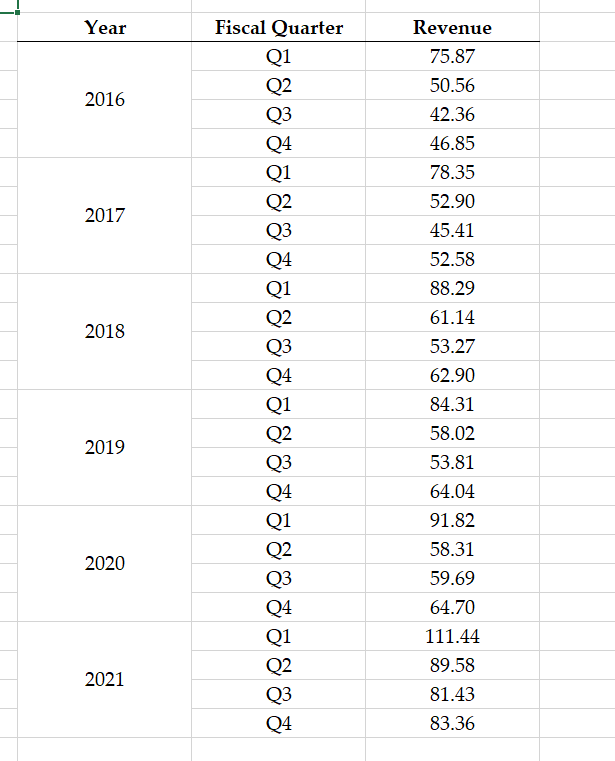
The Apple worksheet in the data pack represents global revenue (measured in billions of dollars) generated by Apple from Q1-2016 to Q4-2021.- a. Construct a line graph. b. Construct a seasonal index for each quarter. Provide a table showing your work. c. Interpret each seasonal index. Year 2016 Revenue 75.87 50.56 42.36 46.85 78.35 52.90 45.41 52.58 88.29 2017 2018 Fiscal Quarter Q1 Q2 Q3 Q4 Q1 Q2 Q3 Q4 Q1 Q2 Q3 Q4 Q1 Q2 Q3 Q4 Q1 Q2 Q3 Q4 Q1 Q2 Q3 Q4 61.14 53.27 62.90 84.31 2019 58.02 53.81 64.04 91.82 58.31 2020 59.69 64.70 111.44 89.58 81.43 83.36 2021
Step by Step Solution
There are 3 Steps involved in it
1 Expert Approved Answer
Step: 1 Unlock

Question Has Been Solved by an Expert!
Get step-by-step solutions from verified subject matter experts
Step: 2 Unlock
Step: 3 Unlock