

Question: The assignment is as follows: please prepare a pro-forma forecast of the income statement and balance sheet for the company for 2021. The company is
The assignment is as follows: please prepare a pro-forma forecast of the income statement and balance sheet for the company for 2021. The company is in IT industry with the SIC code of 7372.
Please answer the following questions: 1) Based on your forecast, does the firm need to raise any external capital for its operations in 2021? 2) The firm is currently making a loss. However, firms have value in part because of the expectation that at some point, they will make a profit. Is there a way to determine the potential value of this firm based on its earnings?
The assumptions you make are completely up to you, but should be reasonable.
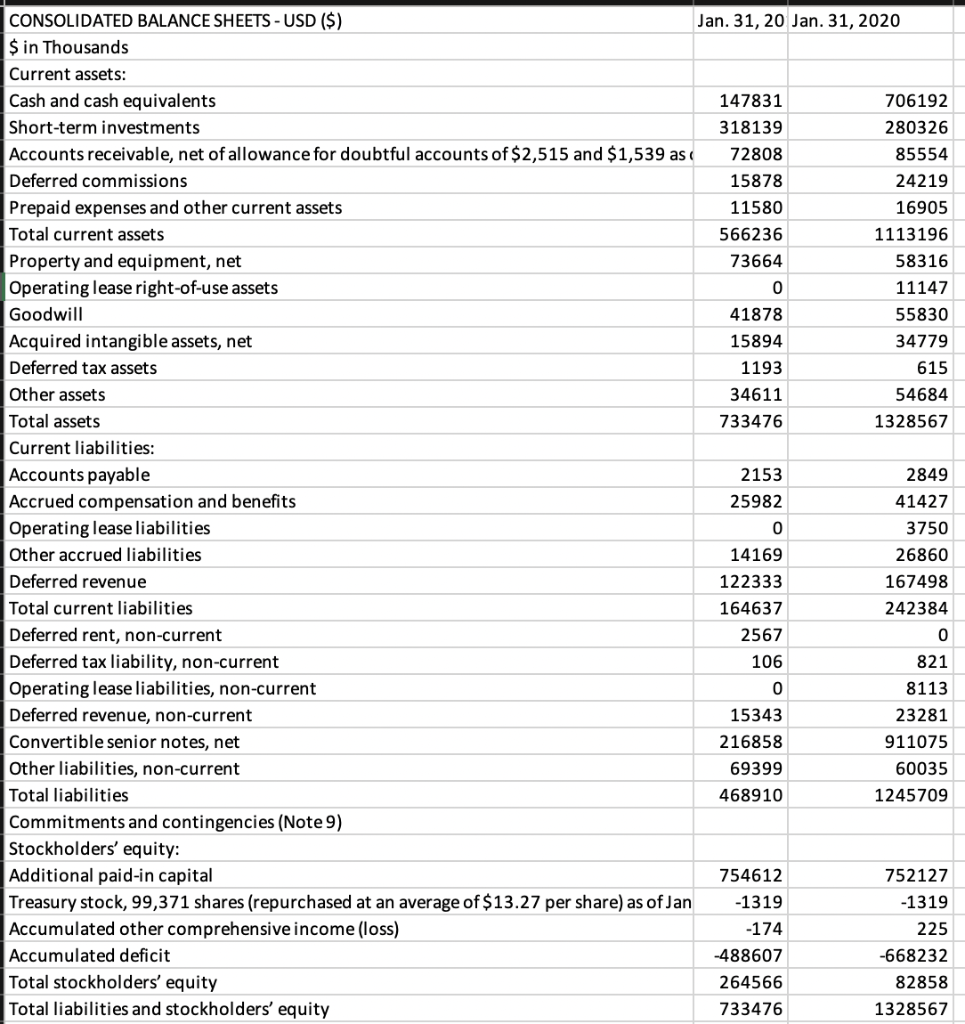
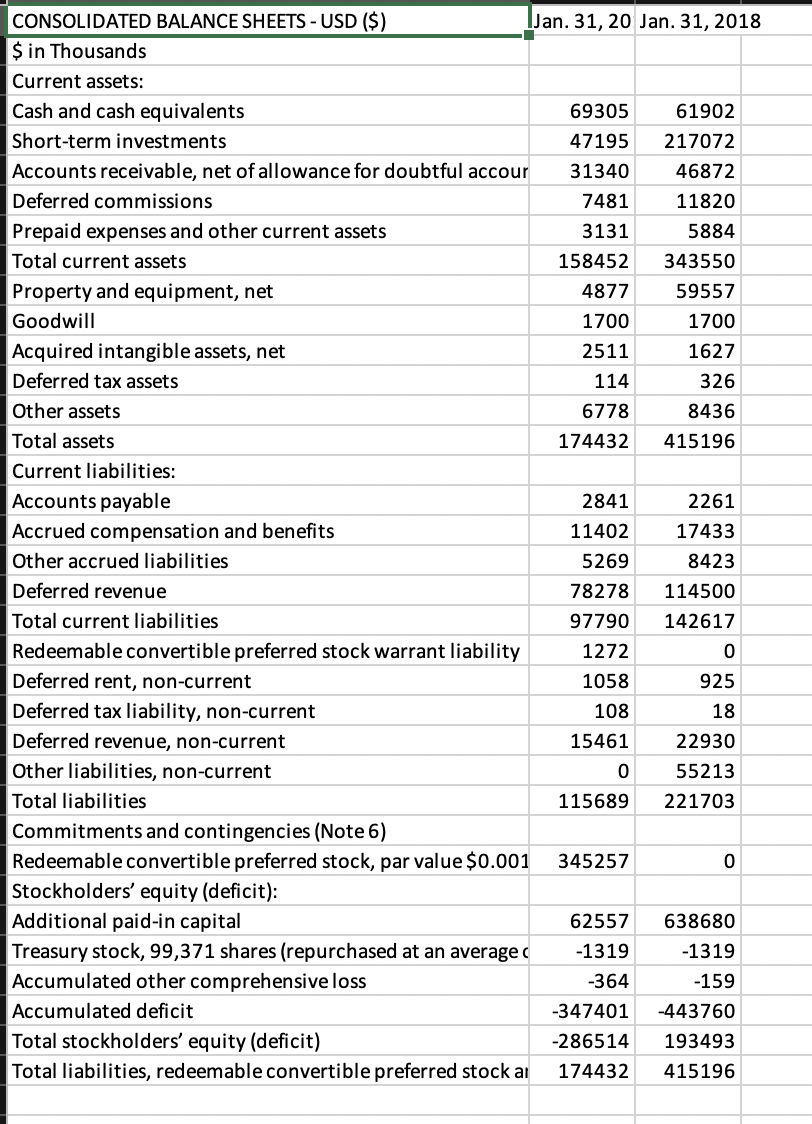
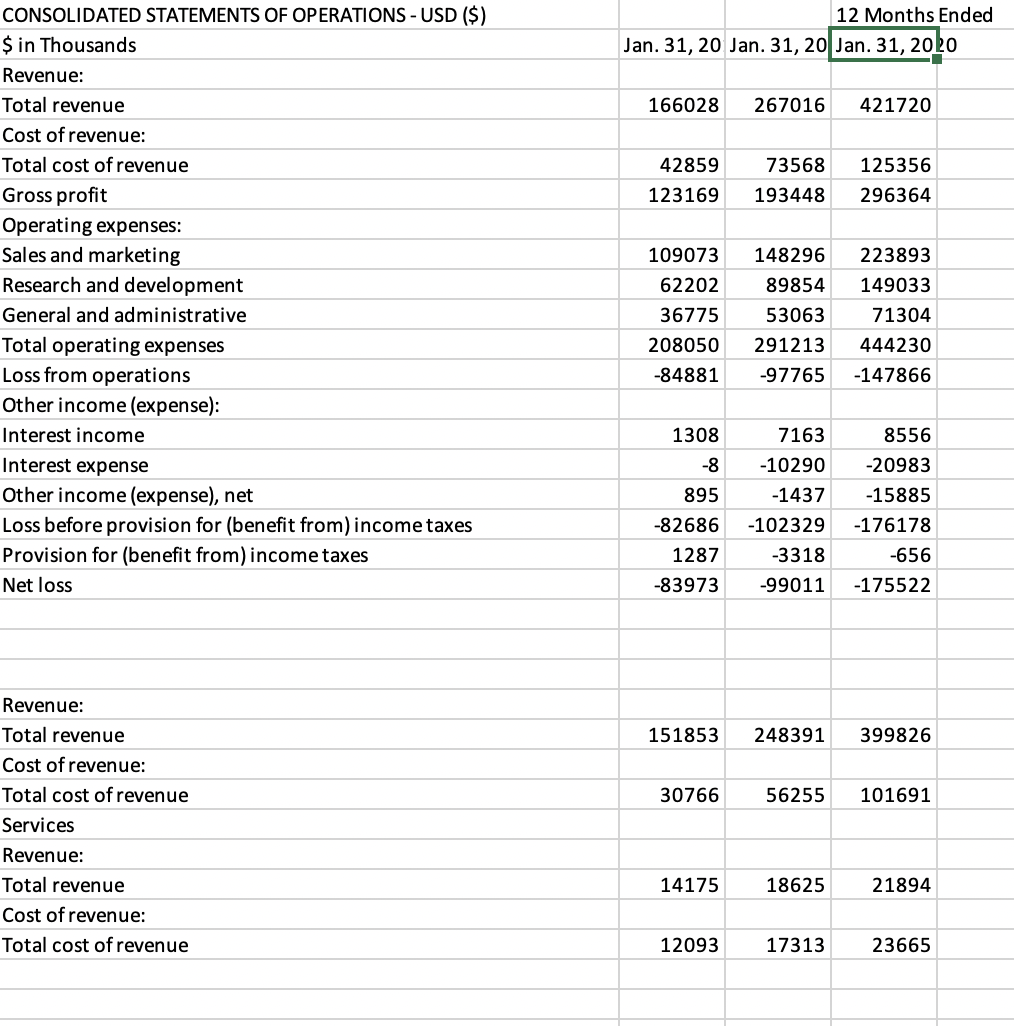
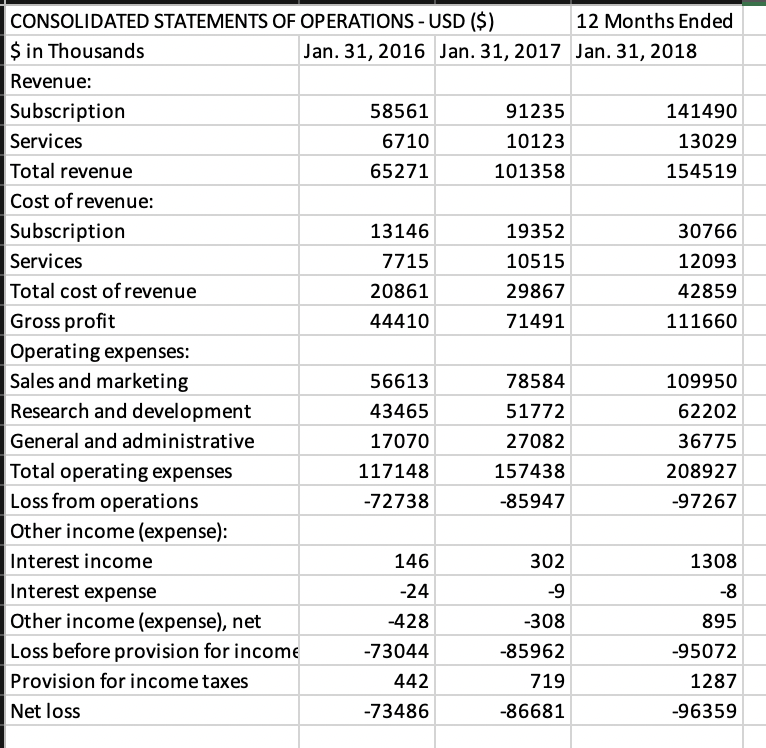
CONSOLIDATED BALANCE SHEETS - USD ($) Jan. 31, 20 Jan. 31, 2020 $ in Thousands Current assets: Cash and cash equivalents 147831 706192 Short-term investments 318139 280326 Accounts receivable, net of allowance for doubtful accounts of $2,515 and $1,539 as 72808 85554 Deferred commissions 15878 24219 Prepaid expenses and other current assets 11580 16905 Total current assets 566236 1113196 Property and equipment, net 73664 58316 Operating lease right-of-use assets 0 11147 Goodwill 41878 55830 Acquired intangible assets, net 15894 34779 Deferred tax assets 1193 615 Other assets 34611 54684 Total assets 733476 1328567 Current liabilities: Accounts payable 2153 2849 Accrued compensation and benefits 25982 41427 Operating lease liabilities 0 3750 Other accrued liabilities 14169 26860 Deferred revenue 122333 167498 Total current liabilities 164637 242384 Deferred rent, non-current 2567 0 Deferred tax liability, non-current 106 821 Operating lease liabilities, non-current 0 8113 Deferred revenue, non-current 15343 23281 Convertible senior notes, net 216858 911075 Other liabilities, non-current 69399 60035 Total liabilities 468910 1245709 Commitments and contingencies (Note 9) Stockholders' equity: onal paid-in capital 754612 752127 Treasury stock, 99,371 shares (repurchased at an average of $13.27 per share) as of Jan -1319 -1319 Accumulated other comprehensive income (loss) -174 225 Accumulated deficit -488607 -668232 Total stockholders' equity 264566 82858 Total liabilities and stockholders' equity 733476 1328567 CONSOLIDATED BALANCE SHEETS - USD ($) Jan. 31, 20 Jan. 31, 2018 $ in Thousands Current assets: Cash and cash equivalents 69305 61902 Short-term investments 47195 217072 Accounts receivable, net of allowance for doubtful accour 31340 46872 Deferred commissions 7481 11820 Prepaid expenses and other current assets 3131 5884 Total current assets 158452 343550 Property and equipment, net 4877 59557 Goodwill 1700 1700 Acquired intangible assets, net 2511 1627 Deferred tax assets 114 326 Other assets 6778 8436 Total assets 174432 415196 Current liabilities: Accounts payable 2841 2261 Accrued compensation and benefits 11402 17433 Other accrued liabilities 5269 8423 Deferred revenue 78278 114500 Total current liabilities 97790 142617 Redeemable convertible preferred stock warrant liability 1272 0 Deferred rent, non-current 1058 925 Deferred tax liability, non-current 108 18 Deferred revenue, non-current 15461 22930 Other liabilities, non-current 0 55213 Total liabilities 115689 221703 Commitments and contingencies (Note 6) Redeemable convertible preferred stock, par value $0.001 345257 0 Stockholders' equity (deficit): Additional paid-in capital 62557 638680 Treasury stock, 99,371 shares (repurchased at an average -1319 -1319 Accumulated other comprehensive loss -364 -159 Accumulated deficit -347401 -443760 Total stockholders' equity (deficit) -286514 193493 Total liabilities, redeemable convertible preferred stock ar 174432 415196 12 Months Ended Jan. 31, 20 Jan. 31, 20 Jan. 31, 2020 166028 267016 421720 73568 42859 123169 125356 296364 193448 CONSOLIDATED STATEMENTS OF OPERATIONS - USD ($) $ in Thousands Revenue: Total revenue Cost of revenue: Total cost of revenue Gross profit Operating expenses: Sales and marketing Research and development General and administrative Total operating expenses Loss from operations Other income (expense): Interest income Interest expense Other income (expense), net Loss before provision for (benefit from) income taxes Provision for (benefit from) income taxes Net loss 109073 62202 36775 208050 -84881 148296 89854 53063 291213 -97765 223893 149033 71304 444230 -147866 1308 -8 895 -82686 7163 -10290 -1437 -102329 -3318 -99011 8556 -20983 -15885 -176178 -656 1287 -83973 -175522 151853 248391 399826 30766 56255 101691 Revenue: Total revenue Cost of revenue: Total cost of revenue Services Revenue: Total revenue Cost of revenue: Total cost of revenue 14175 18625 21894 12093 17313 23665 CONSOLIDATED STATEMENTS OF OPERATIONS - USD ($) 12 Months Ended $ in Thousands Jan. 31, 2016 Jan. 31, 2017 Jan. 31, 2018 Revenue: Subscription 58561 91235 141490 Services 6710 10123 13029 Total revenue 65271 101358 154519 Cost of revenue: Subscription 13146 19352 30766 Services 7715 10515 12093 Total cost of revenue 20861 29867 42859 Gross profit 44410 71491 111660 Operating expenses: Sales and marketing 56613 78584 109950 Research and development 43465 51772 62202 General and administrative 17070 27082 36775 Total operating expenses 117148 157438 208927 Loss from operations -72738 -85947 -97267 Other income (expense): Interest income 146 302 1308 Interest expense -24 -9 -8 Other income (expense), net -428 -308 895 Loss before provision for income -73044 -85962 -95072 Provision for income taxes 442 719 1287 Net loss -73486 -86681 -96359 CONSOLIDATED BALANCE SHEETS - USD ($) Jan. 31, 20 Jan. 31, 2020 $ in Thousands Current assets: Cash and cash equivalents 147831 706192 Short-term investments 318139 280326 Accounts receivable, net of allowance for doubtful accounts of $2,515 and $1,539 as 72808 85554 Deferred commissions 15878 24219 Prepaid expenses and other current assets 11580 16905 Total current assets 566236 1113196 Property and equipment, net 73664 58316 Operating lease right-of-use assets 0 11147 Goodwill 41878 55830 Acquired intangible assets, net 15894 34779 Deferred tax assets 1193 615 Other assets 34611 54684 Total assets 733476 1328567 Current liabilities: Accounts payable 2153 2849 Accrued compensation and benefits 25982 41427 Operating lease liabilities 0 3750 Other accrued liabilities 14169 26860 Deferred revenue 122333 167498 Total current liabilities 164637 242384 Deferred rent, non-current 2567 0 Deferred tax liability, non-current 106 821 Operating lease liabilities, non-current 0 8113 Deferred revenue, non-current 15343 23281 Convertible senior notes, net 216858 911075 Other liabilities, non-current 69399 60035 Total liabilities 468910 1245709 Commitments and contingencies (Note 9) Stockholders' equity: onal paid-in capital 754612 752127 Treasury stock, 99,371 shares (repurchased at an average of $13.27 per share) as of Jan -1319 -1319 Accumulated other comprehensive income (loss) -174 225 Accumulated deficit -488607 -668232 Total stockholders' equity 264566 82858 Total liabilities and stockholders' equity 733476 1328567 CONSOLIDATED BALANCE SHEETS - USD ($) Jan. 31, 20 Jan. 31, 2018 $ in Thousands Current assets: Cash and cash equivalents 69305 61902 Short-term investments 47195 217072 Accounts receivable, net of allowance for doubtful accour 31340 46872 Deferred commissions 7481 11820 Prepaid expenses and other current assets 3131 5884 Total current assets 158452 343550 Property and equipment, net 4877 59557 Goodwill 1700 1700 Acquired intangible assets, net 2511 1627 Deferred tax assets 114 326 Other assets 6778 8436 Total assets 174432 415196 Current liabilities: Accounts payable 2841 2261 Accrued compensation and benefits 11402 17433 Other accrued liabilities 5269 8423 Deferred revenue 78278 114500 Total current liabilities 97790 142617 Redeemable convertible preferred stock warrant liability 1272 0 Deferred rent, non-current 1058 925 Deferred tax liability, non-current 108 18 Deferred revenue, non-current 15461 22930 Other liabilities, non-current 0 55213 Total liabilities 115689 221703 Commitments and contingencies (Note 6) Redeemable convertible preferred stock, par value $0.001 345257 0 Stockholders' equity (deficit): Additional paid-in capital 62557 638680 Treasury stock, 99,371 shares (repurchased at an average -1319 -1319 Accumulated other comprehensive loss -364 -159 Accumulated deficit -347401 -443760 Total stockholders' equity (deficit) -286514 193493 Total liabilities, redeemable convertible preferred stock ar 174432 415196 12 Months Ended Jan. 31, 20 Jan. 31, 20 Jan. 31, 2020 166028 267016 421720 73568 42859 123169 125356 296364 193448 CONSOLIDATED STATEMENTS OF OPERATIONS - USD ($) $ in Thousands Revenue: Total revenue Cost of revenue: Total cost of revenue Gross profit Operating expenses: Sales and marketing Research and development General and administrative Total operating expenses Loss from operations Other income (expense): Interest income Interest expense Other income (expense), net Loss before provision for (benefit from) income taxes Provision for (benefit from) income taxes Net loss 109073 62202 36775 208050 -84881 148296 89854 53063 291213 -97765 223893 149033 71304 444230 -147866 1308 -8 895 -82686 7163 -10290 -1437 -102329 -3318 -99011 8556 -20983 -15885 -176178 -656 1287 -83973 -175522 151853 248391 399826 30766 56255 101691 Revenue: Total revenue Cost of revenue: Total cost of revenue Services Revenue: Total revenue Cost of revenue: Total cost of revenue 14175 18625 21894 12093 17313 23665 CONSOLIDATED STATEMENTS OF OPERATIONS - USD ($) 12 Months Ended $ in Thousands Jan. 31, 2016 Jan. 31, 2017 Jan. 31, 2018 Revenue: Subscription 58561 91235 141490 Services 6710 10123 13029 Total revenue 65271 101358 154519 Cost of revenue: Subscription 13146 19352 30766 Services 7715 10515 12093 Total cost of revenue 20861 29867 42859 Gross profit 44410 71491 111660 Operating expenses: Sales and marketing 56613 78584 109950 Research and development 43465 51772 62202 General and administrative 17070 27082 36775 Total operating expenses 117148 157438 208927 Loss from operations -72738 -85947 -97267 Other income (expense): Interest income 146 302 1308 Interest expense -24 -9 -8 Other income (expense), net -428 -308 895 Loss before provision for income -73044 -85962 -95072 Provision for income taxes 442 719 1287 Net loss -73486 -86681 -96359
Step by Step Solution
There are 3 Steps involved in it

Get step-by-step solutions from verified subject matter experts