Question: The assignment should include an Excel spreadsheet with linked cells to document your calculations and a written discussion (either in Word or included in the
The assignment should include an Excel spreadsheet with linked cells to document your calculations and a written discussion (either in Word or included in the Excel spreadsheet) comparing and contrasting the investment performance of the portfolios.
Assignment Instructions
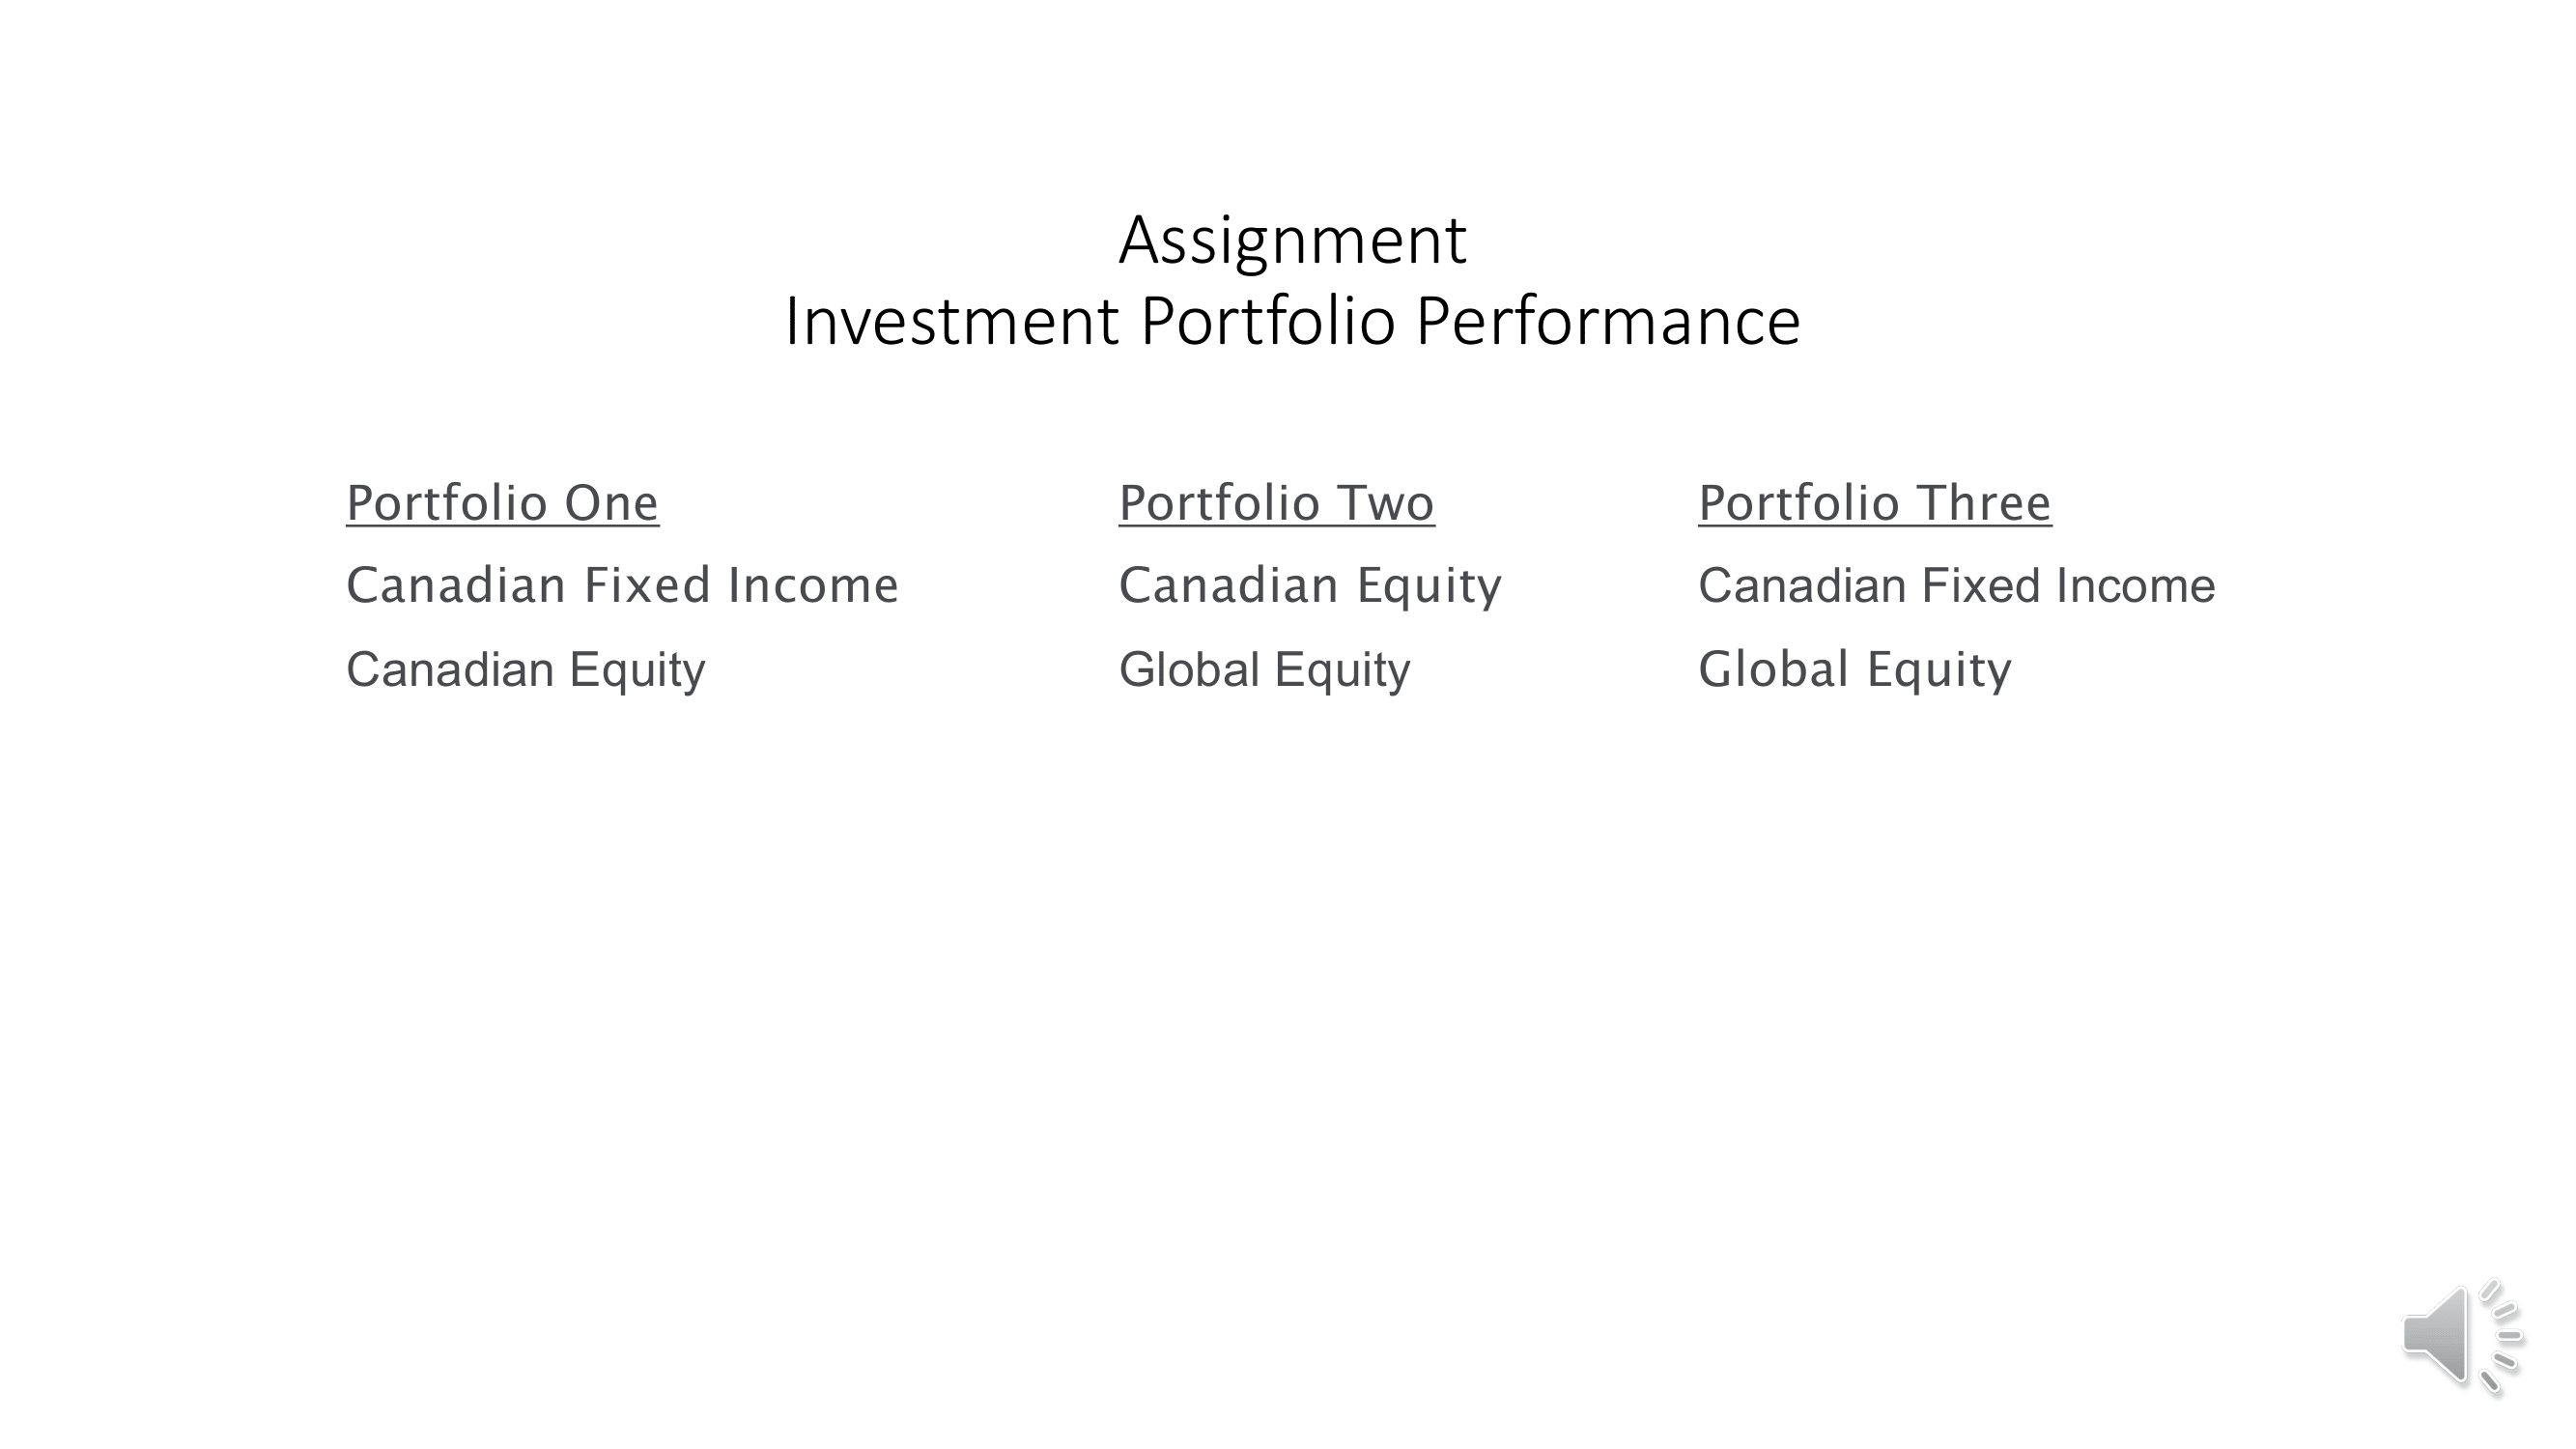
In the Content Section under Assignment is a Powerpoint file with audio input. It sets out the structure of the assignment material. In summary, the task is to examine and compare the performance of three investment portfolios with respect to rate of return and price volatility. Each of the three portfolios is made up of two investment funds. You will assess ten years of historical price information for three investment funds and combine these into the three investment portfolios as follows:
Portfolio OnePortfolio TwoPortfolio Three
Canadian Fixed income Fund Canadian Equity Fund Canadian Fixed Income Fund
Canadian Equity Fund Global Equity Fund Global Equity Fund
To access each fund's ten-year performance record, use the following link:
Morningstar.ca.
Click: Funds
Tools
Fund Screener
Morningstar Category
In Morningstar Category, choose one fund with a ten-year performance history from each of the following three groups:
Canadian Corporate Fixed Income
Canadian Focused Equity
Global Equity
Extract the 10-year performance data from the Total Return% / Investment. Also examine the holdings of the fund by accessing Portfolio under the fund's title.
As an example, I have chosen a Global Equity fund - AGF Elements Global Portfolio CI. Series F
AGF Elements Global Portfolio Cl Ser F, Fund, portfolio | Morningstar
The fund has 53% U.S. Equity and 30% International Equity
The relevant data to extract is the latest ten-year performance history which for this fund is:
2012
8.28
2013
22.01
2014
8.49
2015
15.73
2016
2.27
2017
11.97
2018
(6.26)
2019
16.03
2020
11.35
2021
14.75
Average
10.46
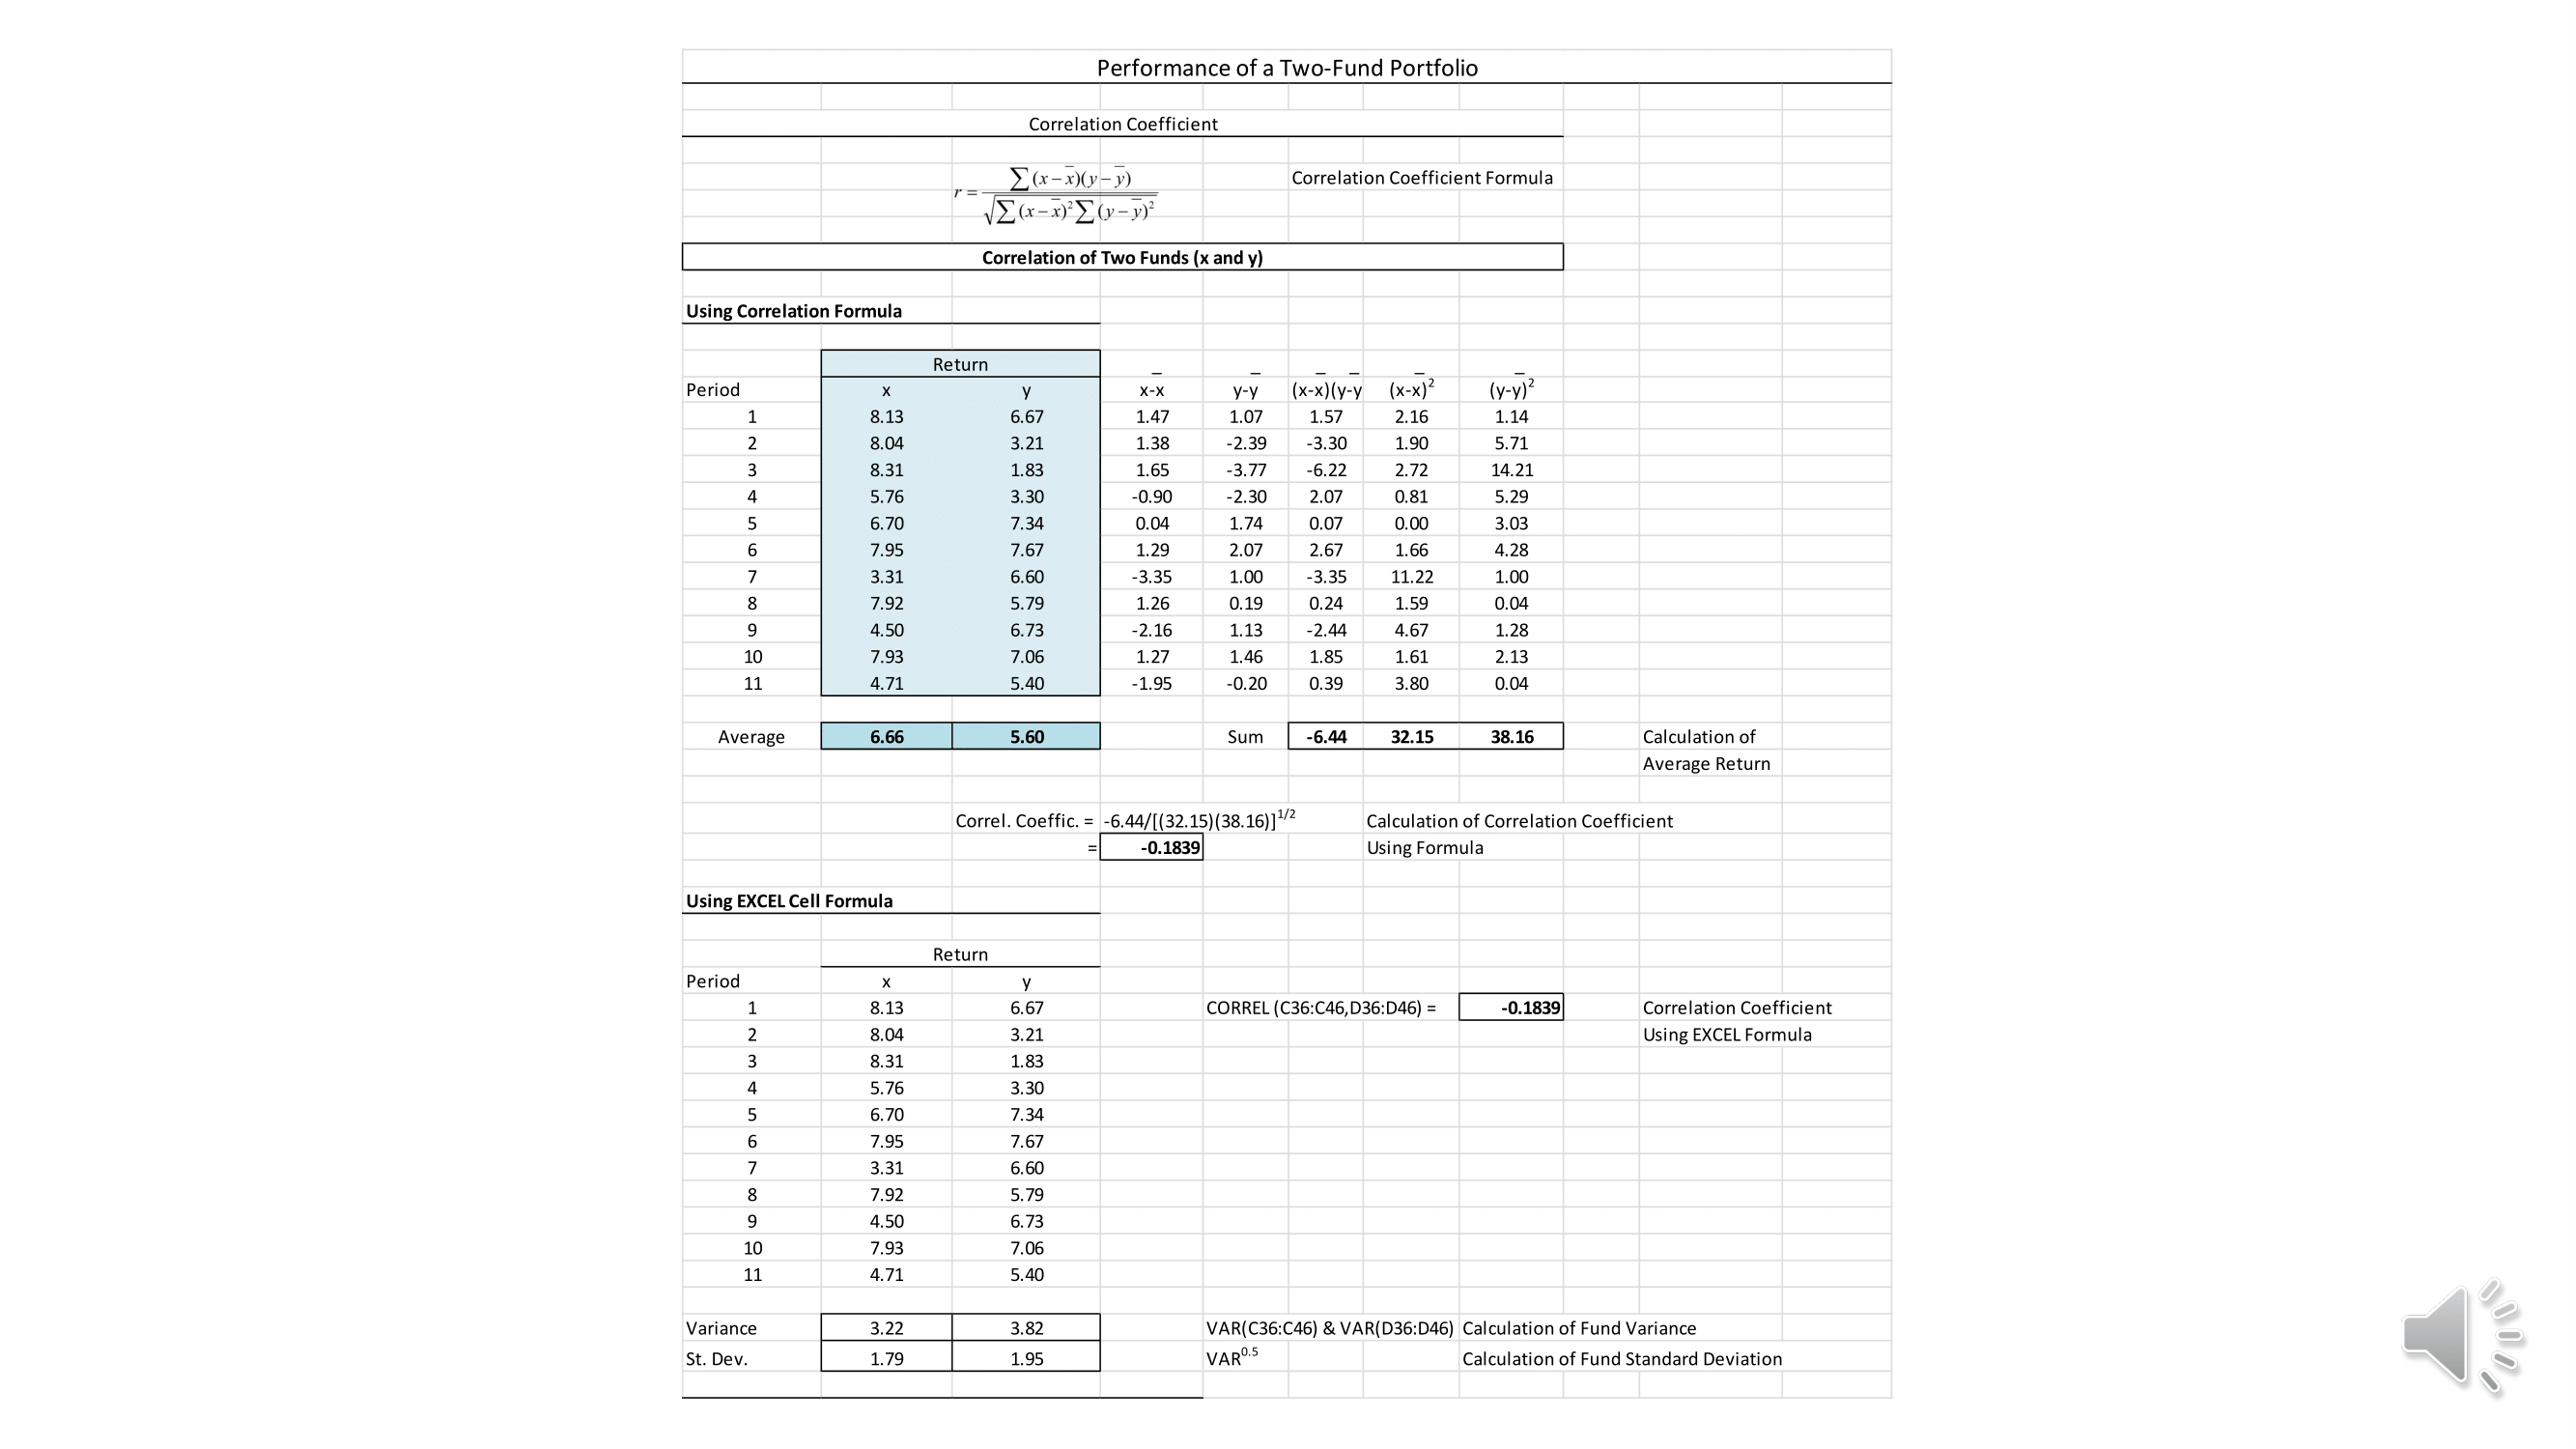
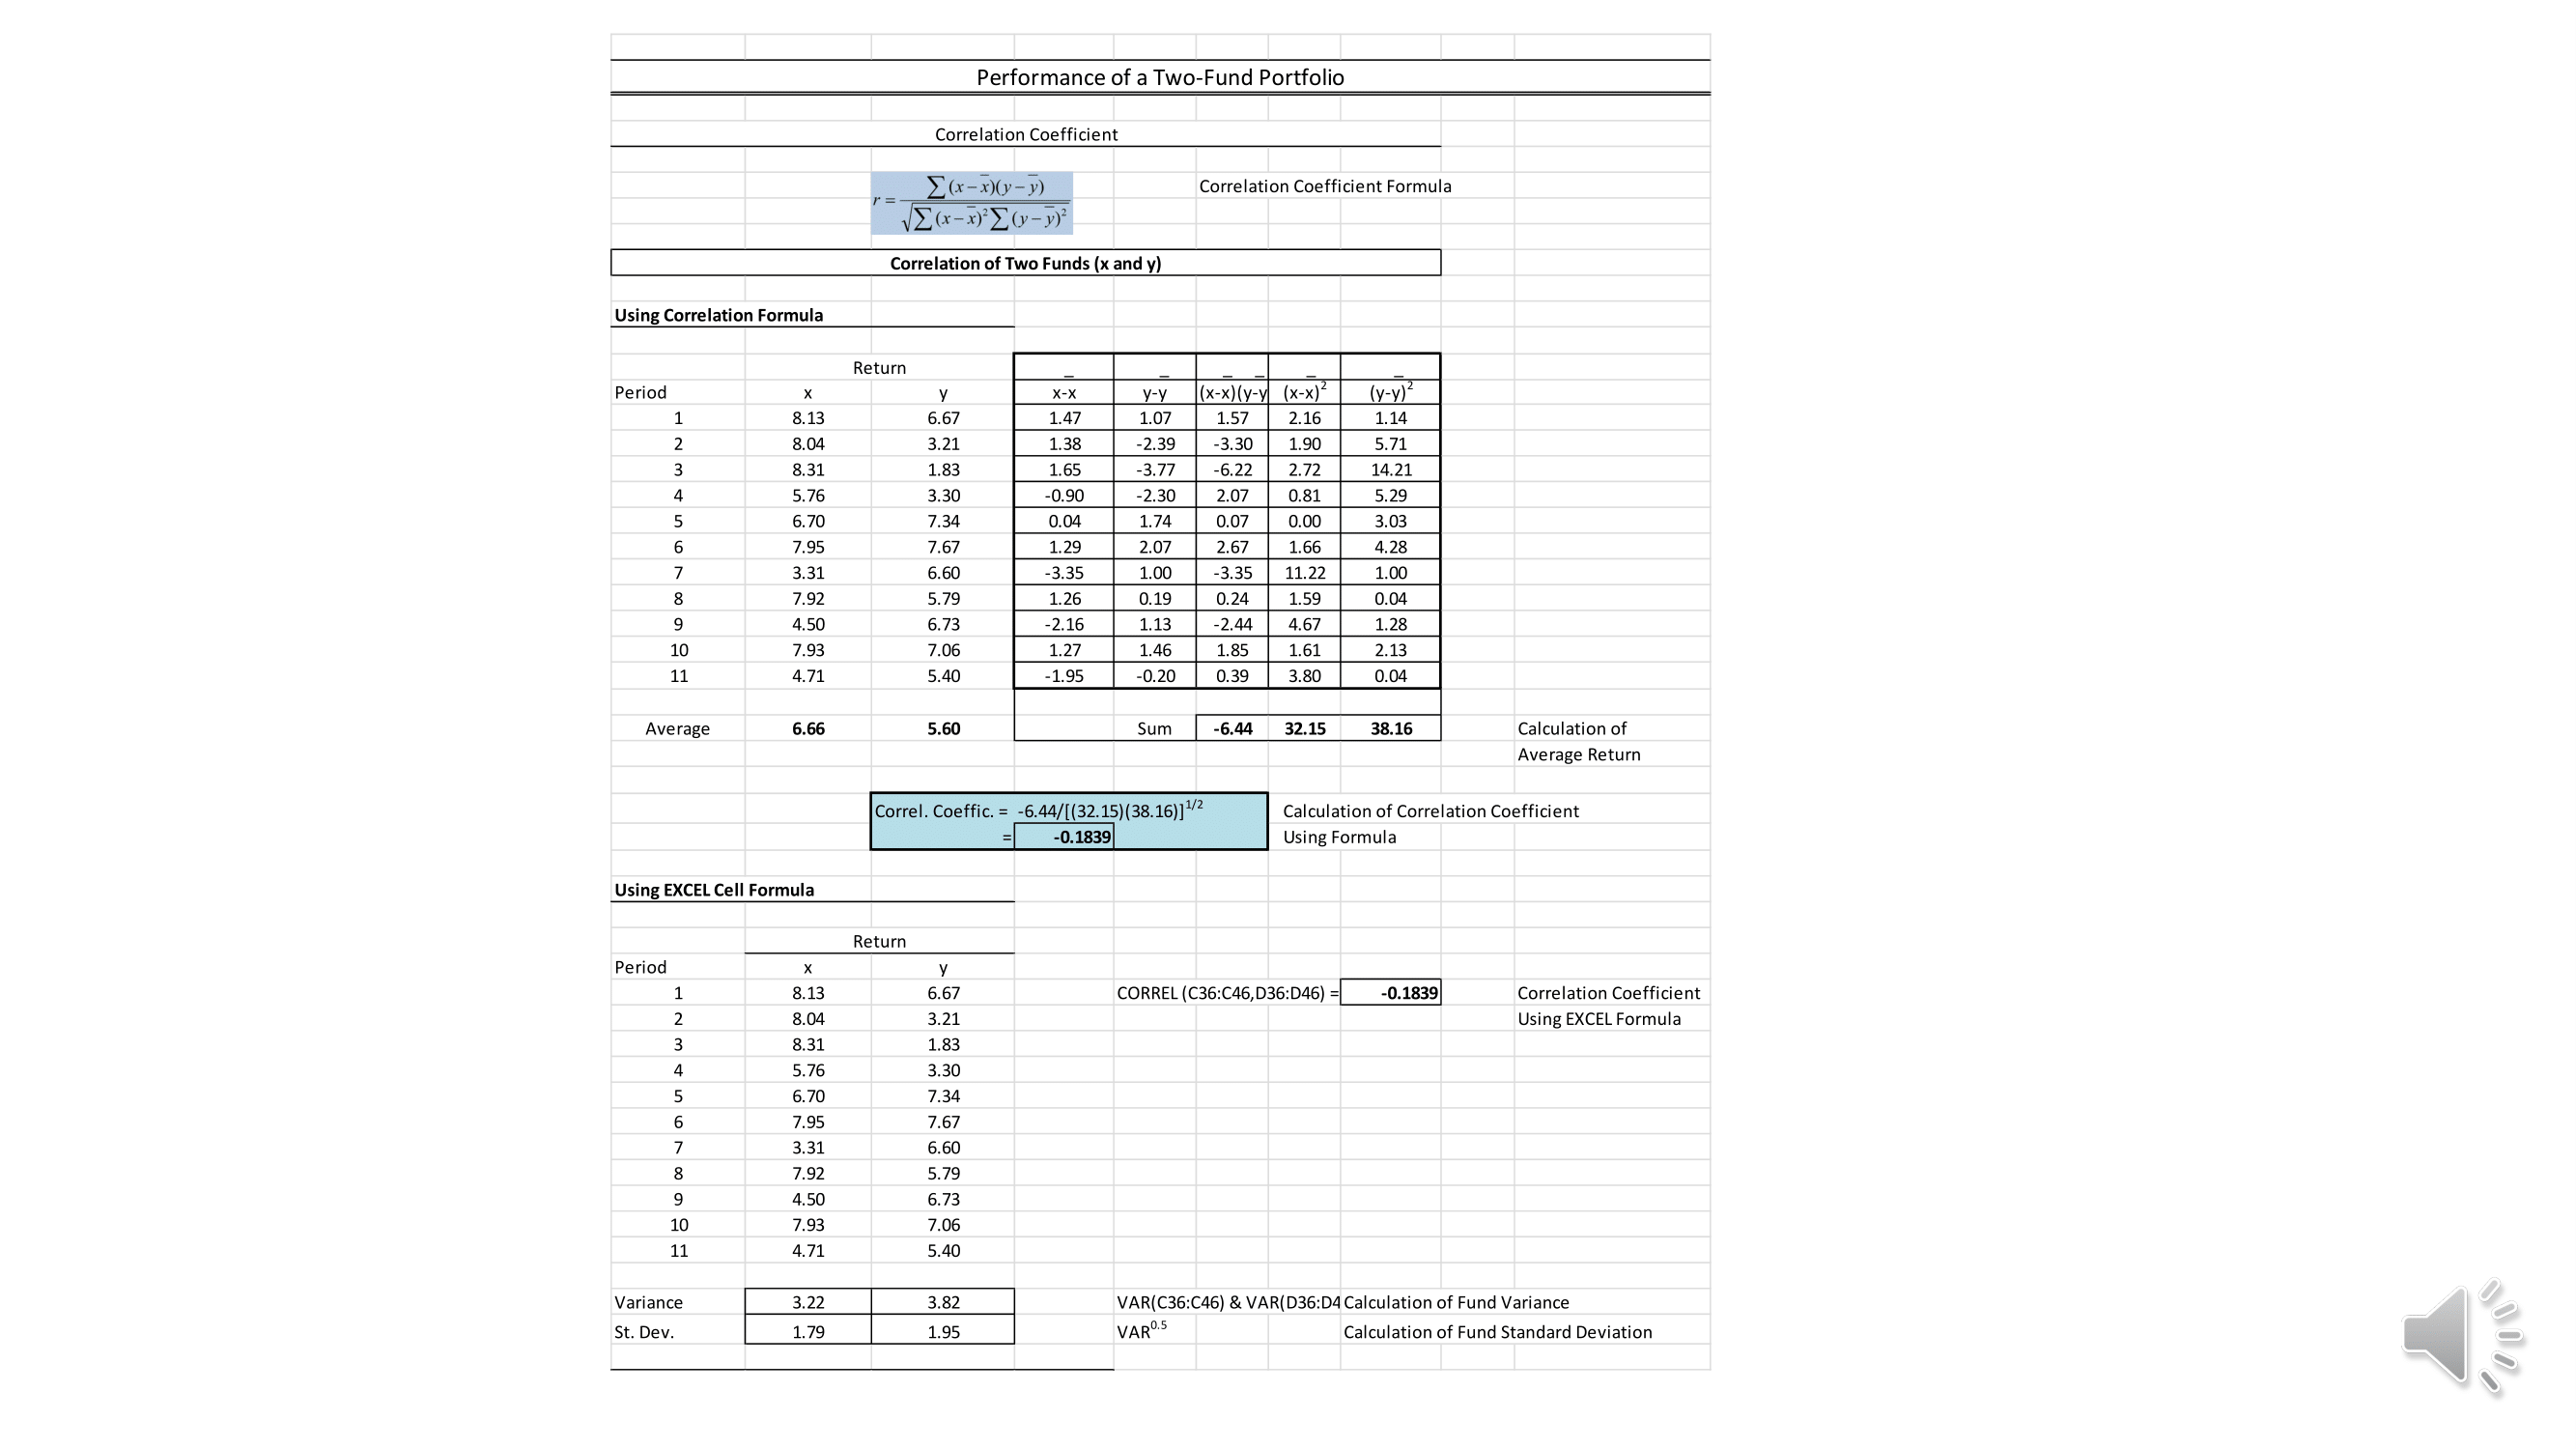
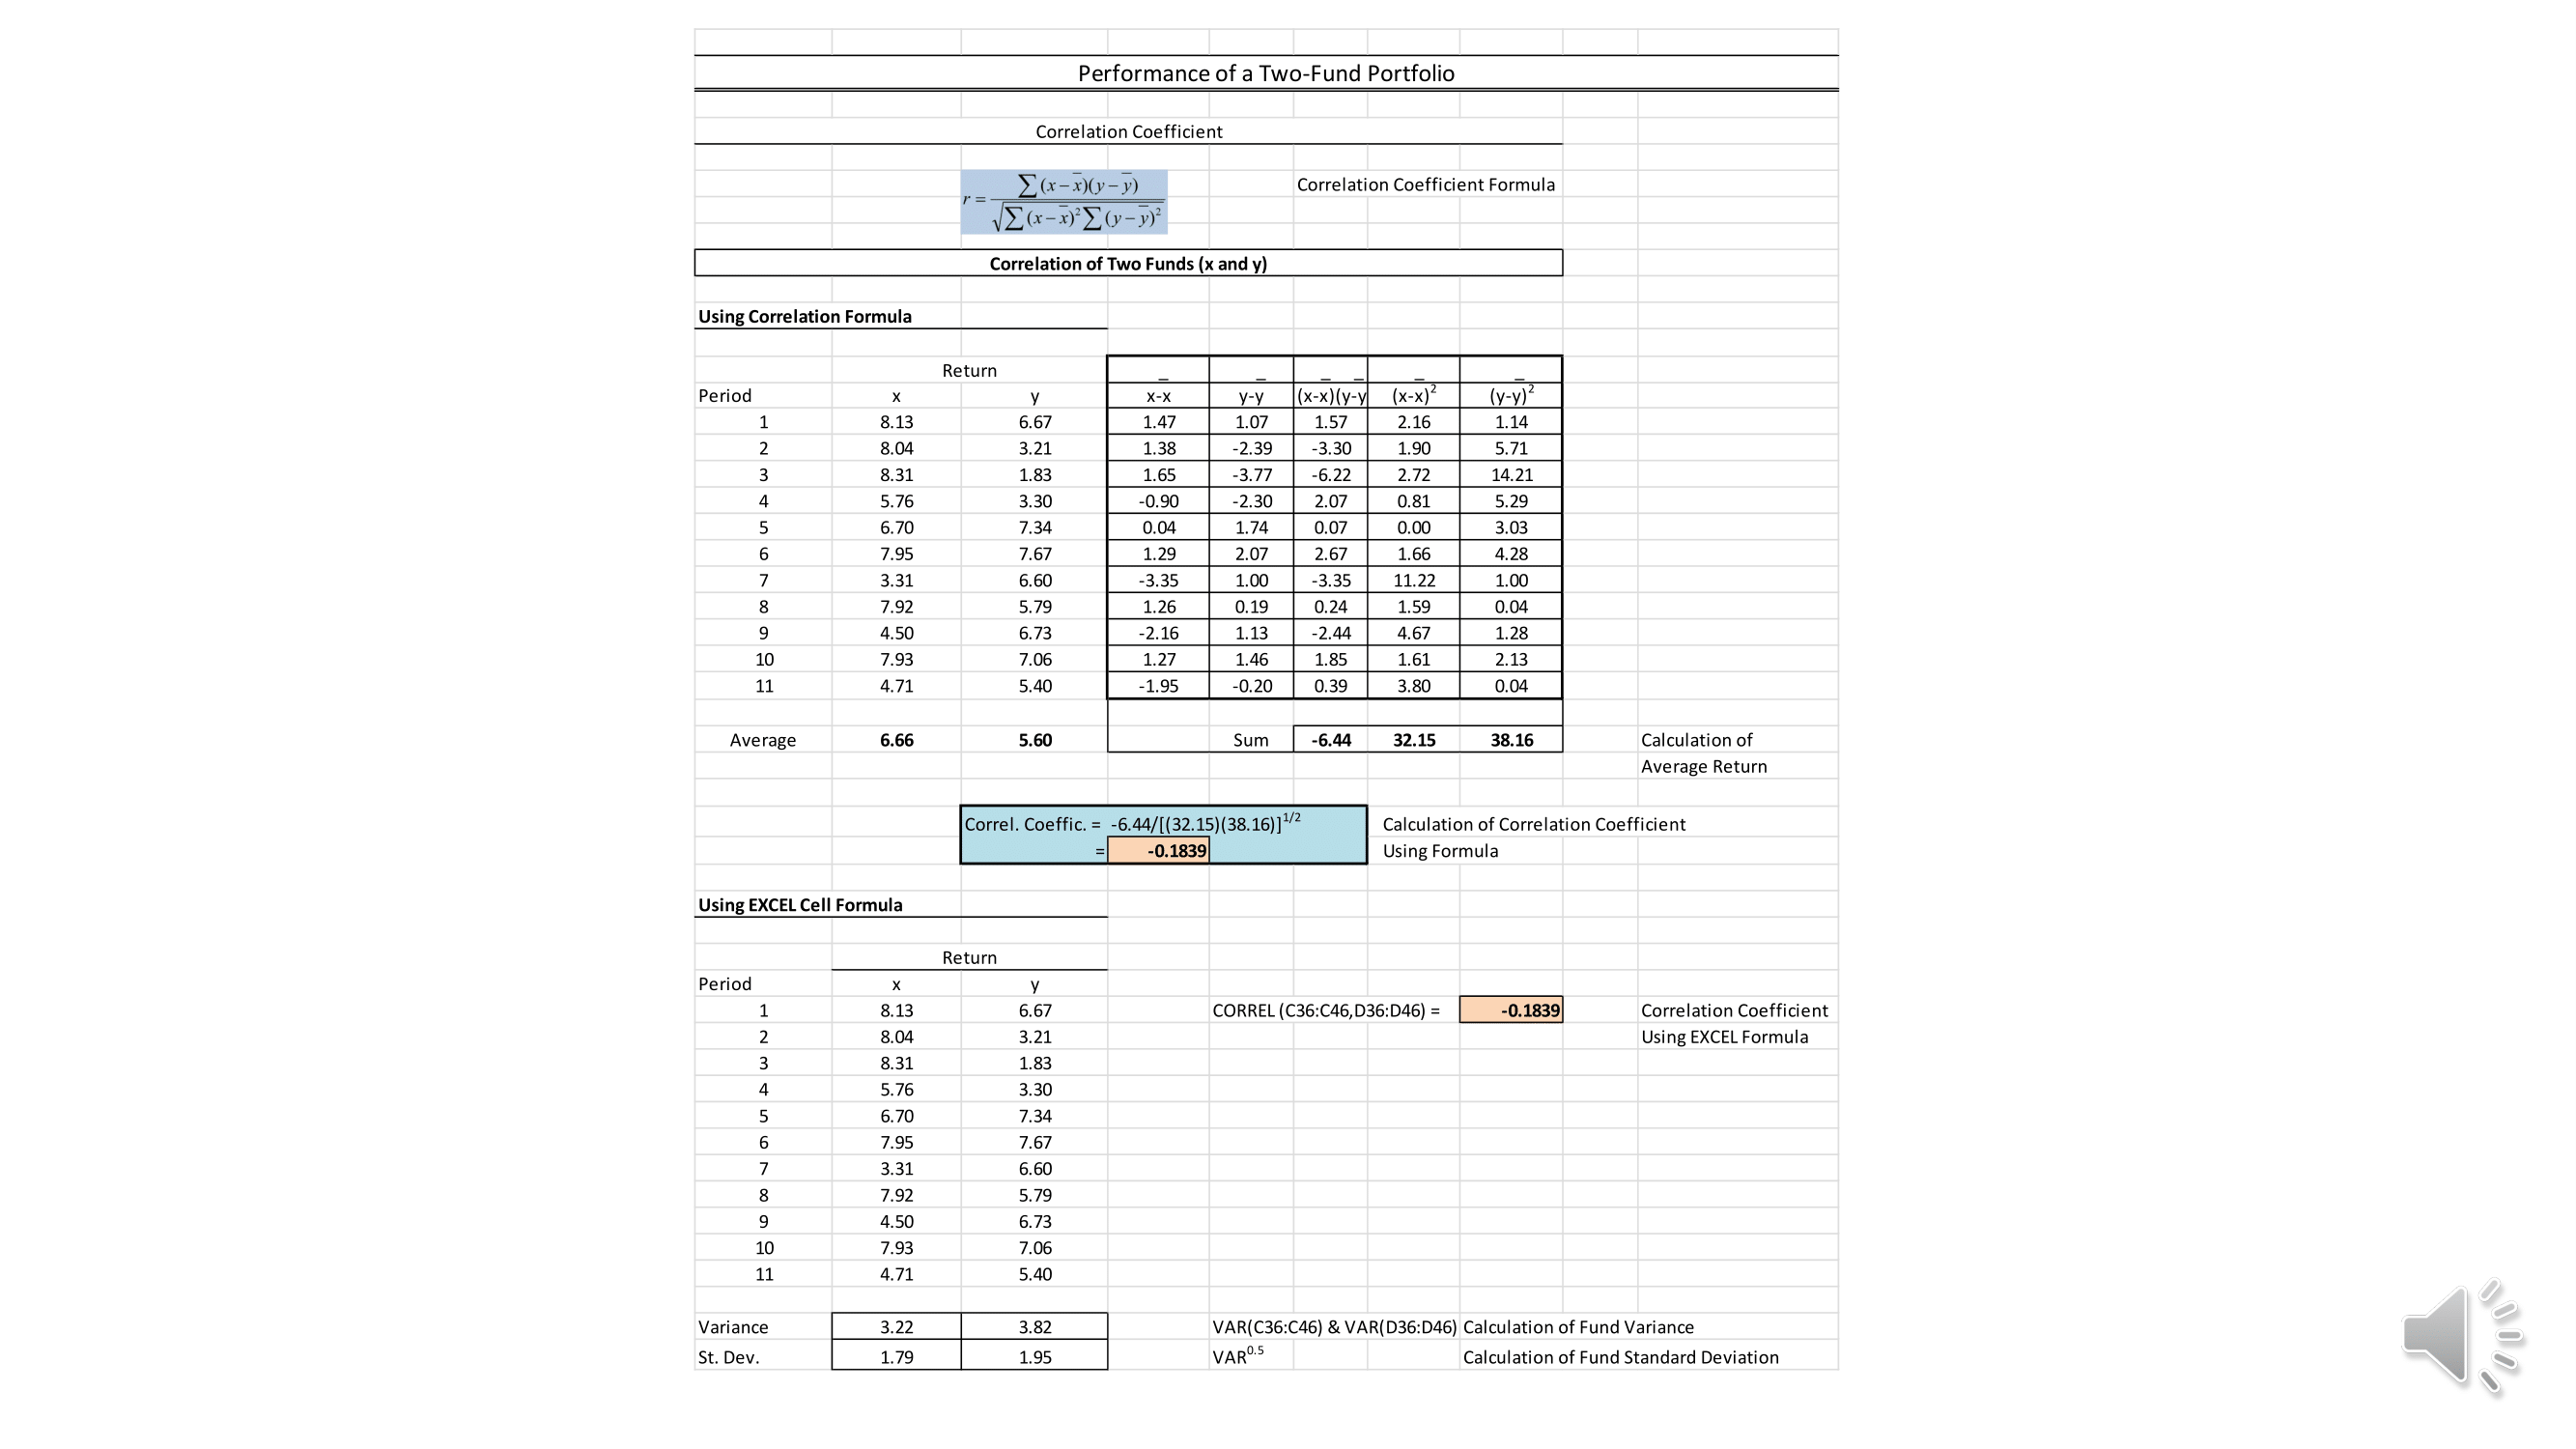
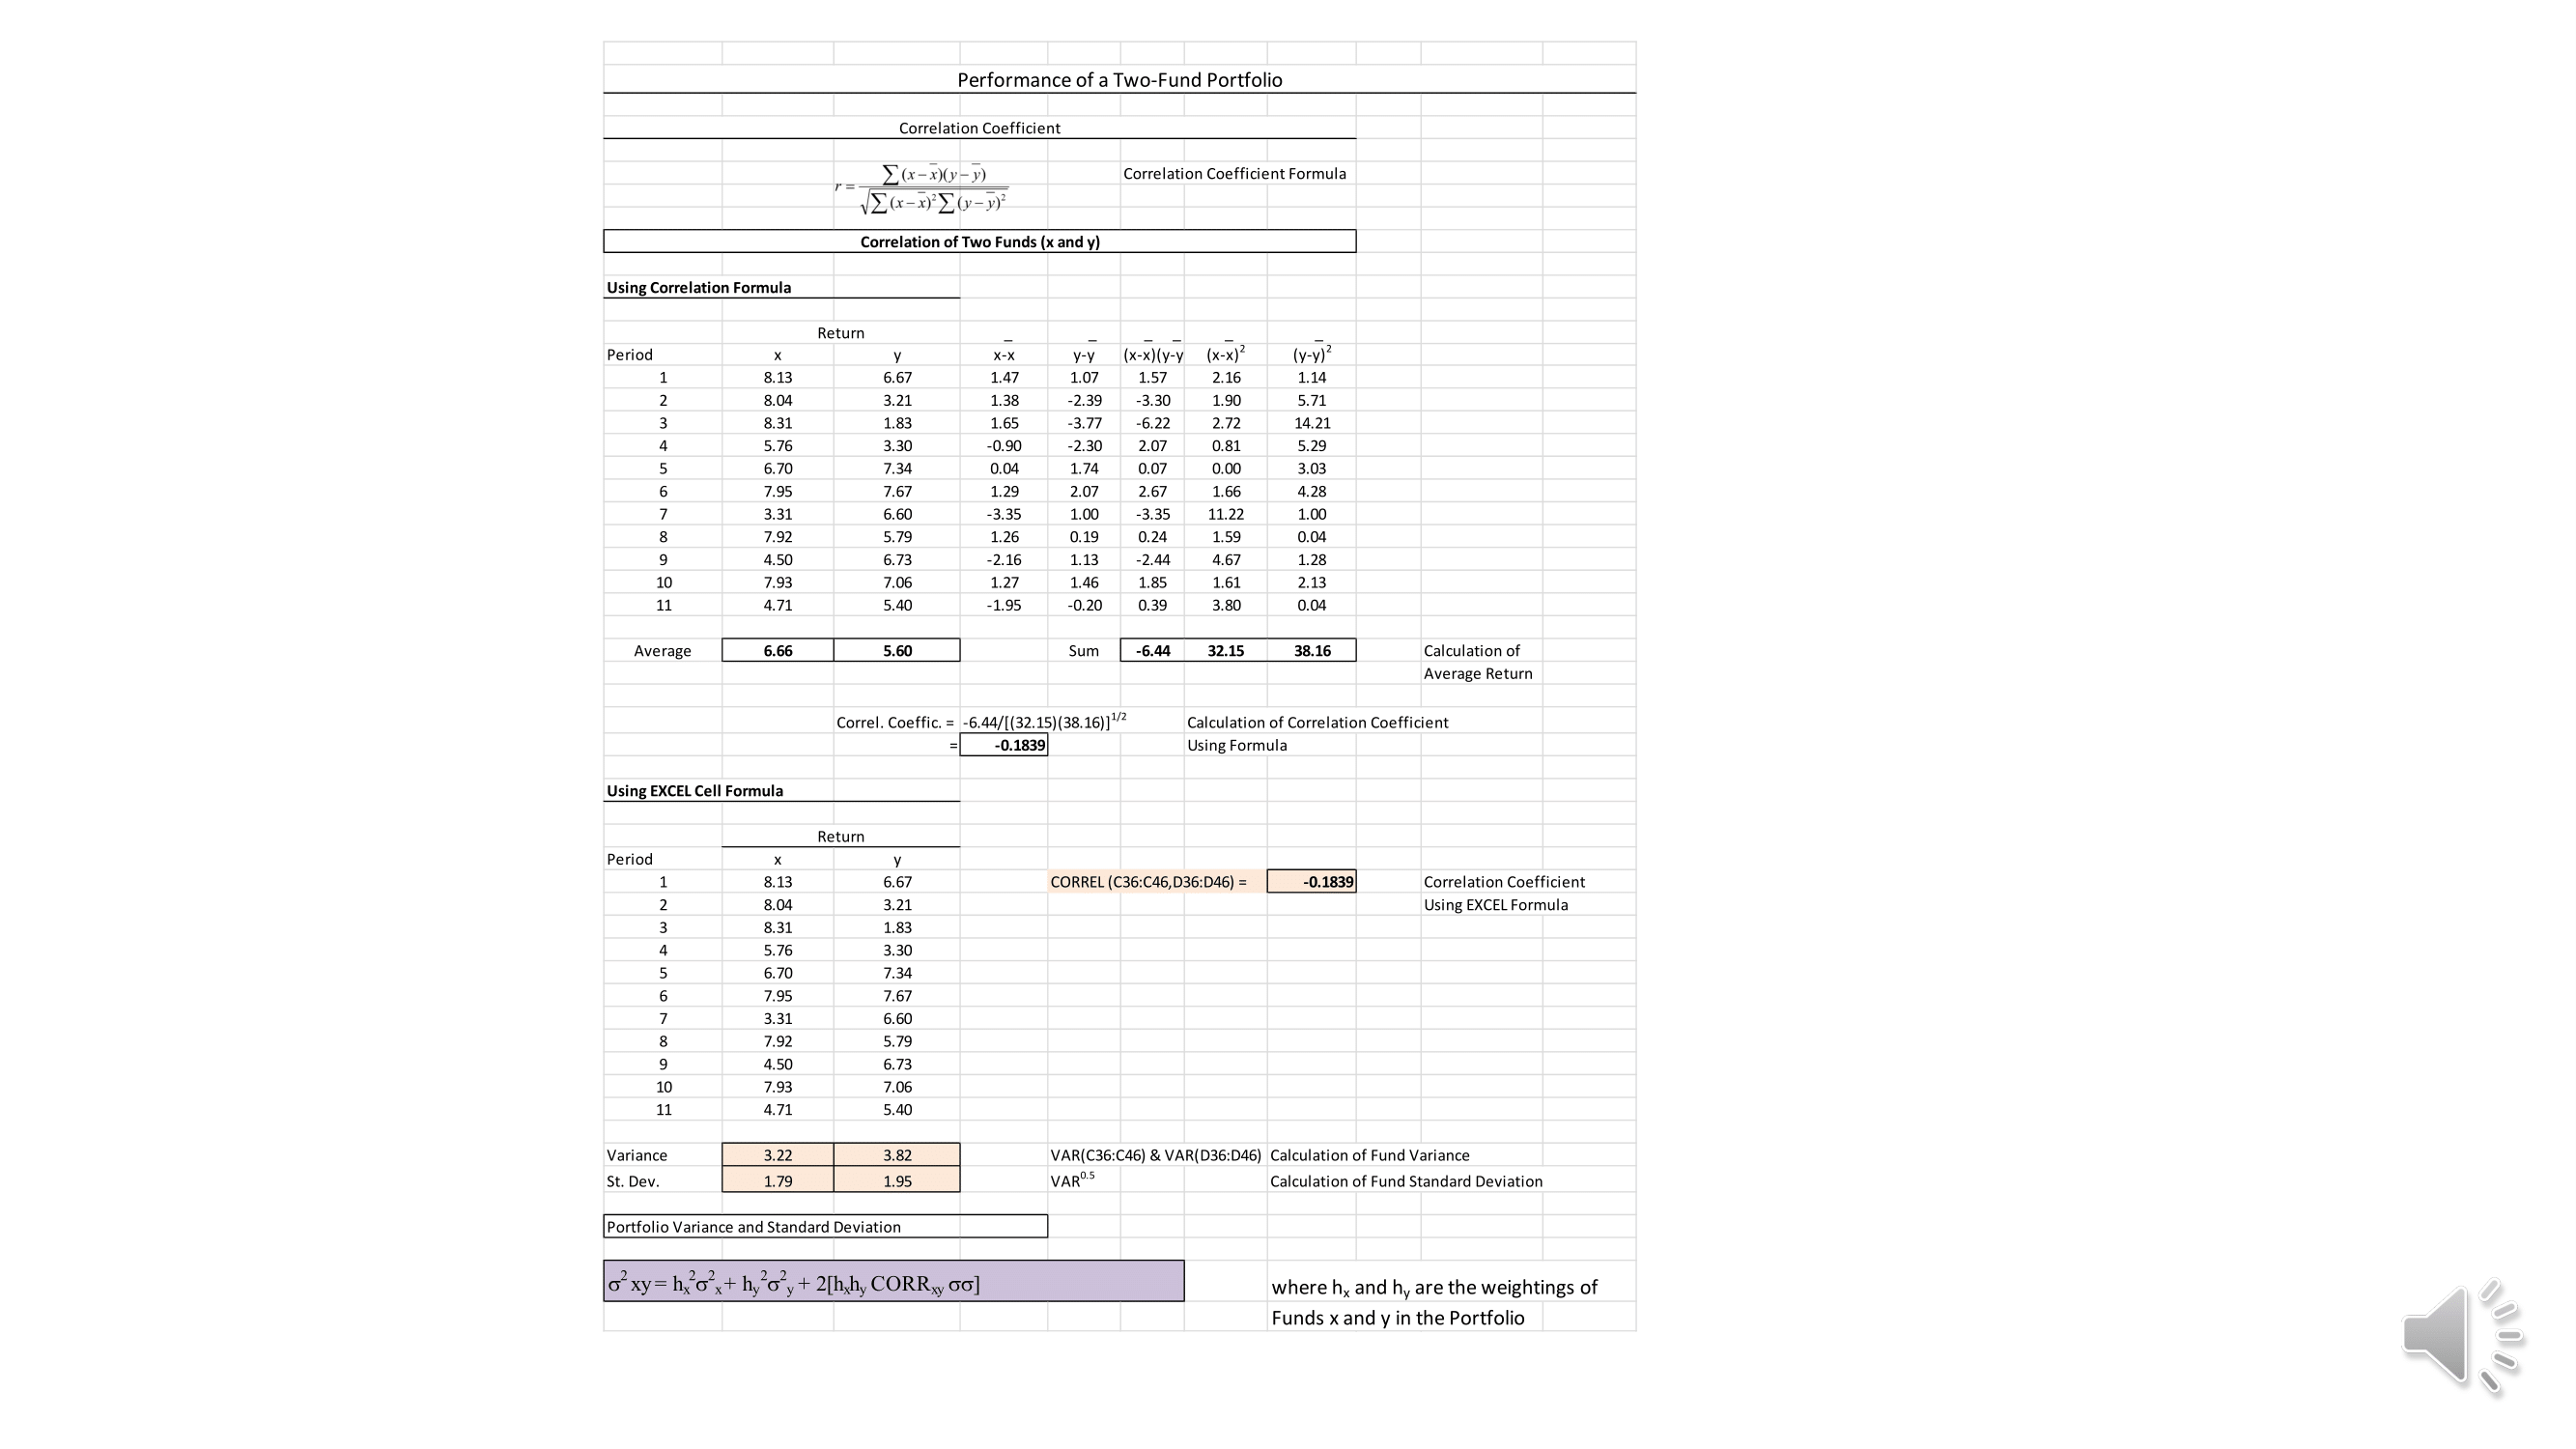
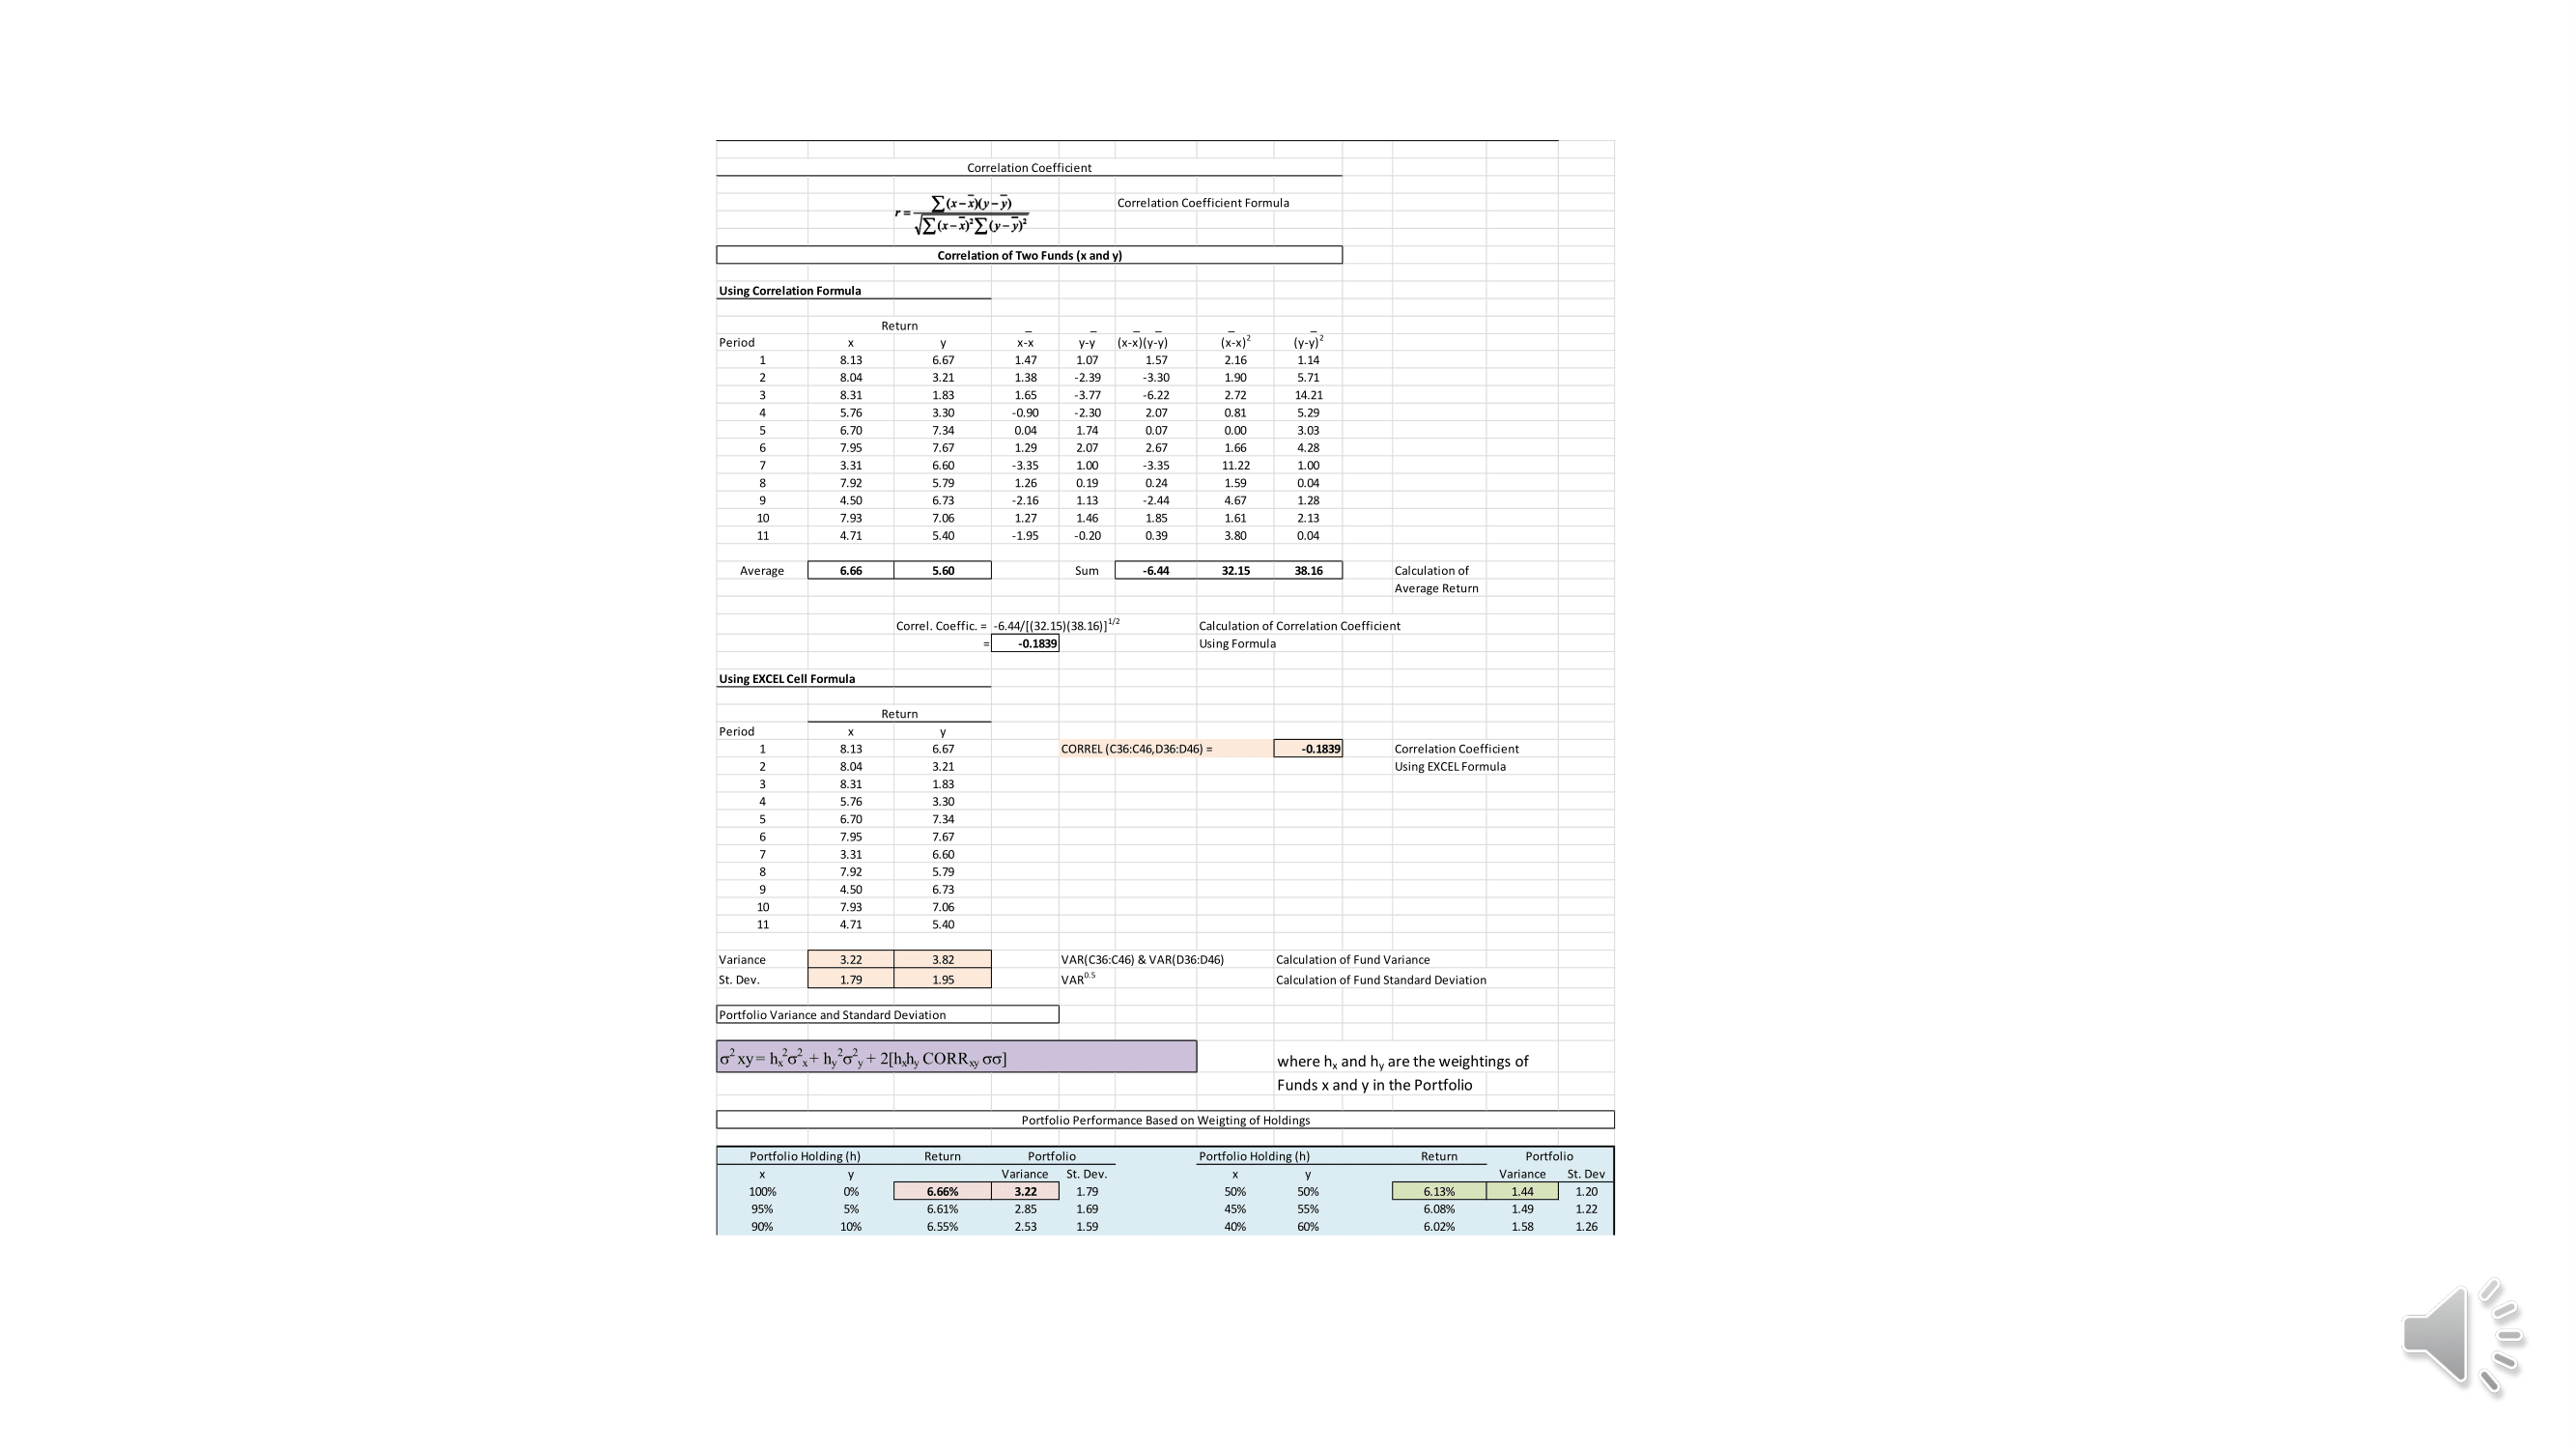
Assignment Investment Portfolio Performance Portfolio One Portfolio Two Portfolio Three Canadian Fixed Income Canadian Equity Canadian Fixed Income Canadian Equity Global Equity Global EquityPerformance of a Two-Fund Portfolio Correlation Coefficient E( x - x)( v-y) Correlation Coefficient Formula VZ ( x - x)[(-1) Correlation of Two Funds (x and y) Using Correlation Formula Return Period X-X y-y (x-x) (y-y ( x-x ) 2 (y-y)2 1 8.13 6.67 1.47 1.07 1.57 2.16 1.14 8.04 3.21 1.38 -2.39 -3.30 1.90 5.71 8.31 1.83 1.65 -3.77 -6.22 2.72 14.21 5.76 3.30 -0.90 -2.30 2.07 0,81 5.29 6.70 7.34 0.04 1.74 0.07 3.03 5 4 CO V OUT A W N 7.95 7.67 1.29 2.07 2.67 1.66 4.28 3,31 5.60 -3.35 1.00 .3.35 11.22 1.00 7.92 5.79 1.26 0.19 0.24 1.59 0.04 4.50 6.73 -2.16 1.13 -2.44 4.67 1.28 7.93 7.06 1.27 1.46 1.85 1.61 2.13 11 4.71 5.40 -1.95 -0.20 0.39 3.80 0.04 Average 6.66 5.60 Sum -6.44 32.15 38.16 Calculation of Average Return Correl. Coeffici Calculation of Correlation Coeffic -0.1839 Using Formula Using EXCEL Cell Formula Return Period X y 8.13 6.67 CORREL (C36:C46, D36:D46) = -0.1839 Correlation Coefficient 8.04 3.21 Using EXCEL Formula 8.31 1.83 5.76 3.30 6.70 7.34 7.95 7.67 3.31 6.60 7.92 5.79 4.50 6.73 7.93 7.06 11 4.71 5.40 Variance 3.22 3.82 VAR(C36:C46) & VAR(D36:D46) Calculation of Fund Variance St. Dev. 1.79 1.95 VARO.5 Calculation of Fund Standard DeviationPerformance of a Two-Fund Portfolio Correlation Coefficient [( x - x)( V-y) Correlation Coefficient Formula VE ( x - x) [( - V) Correlation of Two Funds (x and y) Using Correlation Formula Return Period X-X y-y ( x-x) (y-y (x-x)2 (y-y) 1 8.13 6.67 1.47 1.07 1.57 2.16 1.14 8.04 3.21 1.38 -2.39 -3.30 1.90 5.71 8.31 1.83 1.65 -3.77 -6.22 2.72 14.21 5.76 3.30 -0.90 -2.30 2.07 0.81 5.29 6.70 7.34 0.04 1.74 0.07 0.00 3.03 5 4 0 V O U A W N 7.95 7.67 1.29 2.07 2.67 1.66 4.28 3.31 6.60 -3.35 1.00 -3.35 11.22 1.00 7.92 5.79 1.26 0.19 0.24 1.59 0.04 4.50 6.73 -2.16 1.13 -2.44 4.67 1.28 7.93 7.06 1.27 1.46 1.85 1.61 2.13 11 4.71 5.40 -1.95 -0.20 0.39 3.80 0.04 Average 99'9 5.60 Sum -6.44 32.15 38.16 Calculation of Average Return Correl. Coeffic Calculation of Correlation Coefficient -0.1839 Using Formula Using EXCEL Cell Formula Return Period 8.13 6.67 CORREL (C36:C46, D36:D46) = -0.1839 Correlation Coefficient 8.04 3.21 Using EXCEL Formula 8.31 1.83 5.76 3.30 4 0 V ON UI A W N H 6.70 7.34 7.95 7.67 3.31 6.60 7.92 5.79 4.50 6.73 10 7.93 7.06 11 4.71 5.40 Variance 3.22 3.82 VAR(C36:C46) & VAR(D36:D4 Calculation of Fund Variance St. Dev. 1.79 1.95 VARO.5 Calculation of Fund Standard DeviationPerformance of a Two-Fund Portfolio Correlation Coefficient [ ( x -x) ( y-y) Correlation Coefficient Formula VE ( x - x) [( -V) Correlation of Two Funds (x and y) Using Correlation Formula Return Period X-X y-y (x-x) (y-y ( x-x) 2 (y-y) 8.13 6.67 1.47 1.07 1.57 2.16 1.14 J H 8.04 3.21 1.38 -2.39 -3.30 1.90 5.71 - W N 8.31 1.83 1.65 -3.77 -6.22 2.72 14.21 5.76 3.30 -0.90 2.30 2.07 0.81 5.29 6.70 7.34 0.04 1.74 0.07 0.00 3.03 7.95 7.67 1.29 2.07 2.67 1.66 4.28 3.31 6.60 3.35 1.00 -3.35 11.22 1.00 7.92 5.79 1.26 0.19 0.24 1.59 0.04 4.50 6.73 -2.16 1.13 -2.44 4.67 1.28 10 7.93 7.06 1.27 1.46 1.85 1.61 2.13 11 4.71 5.40 -1.95 -0.20 0.39 3.80 0.04 Average 6.66 5.60 Sum -6.44 32.15 38.16 Calculation of Average Return Correl. Coeffic Calculation of Correlation Coefficient = -0.1839 Using Formula Using EXCEL Cell Formula Return Period 8.13 6.67 CORREL (C36:C46, D36:D46) = -0.1839 Correlation Coefficient 8.04 3.21 Using EXCEL Formula - W N 8.31 1.83 4 5.76 3.30 6.70 7.34 7.95 7.67 3.31 6.60 7.92 5.79 4.50 6.73 10 7.93 7.06 11 4.71 5.40 Variance 3.22 3.82 VAR(C36:C46) & VAR(D36:D46) Calculation of Fund Variance St. Dev. 1.79 1.95 VARO.5 Calculation of Fund Standard DeviationPerformance of a Two-Fund Portfolio Correlation Coefficient (x -x)(-y) Correlation Coefficient Formula Correlation of Two Funds (x and y) Using Correlation Formula Return Period X-X y-y ( x-x ) (y-y ( x-x ) 2 (y-y) 8.13 6.67 1.47 1.07 1.57 2.16 1.14 8.04 3.21 1.38 -2.39 -3.30 1.90 5.71 8.31 1.83 1.65 3.77 -6.22 2.72 14.21 U D W N 5.76 3.30 -0.90 -2.30 207 0,81 5.29 6,70 7.34 0.04 1.74 0.07 0.00 3.03 7.95 7.67 1.29 2.07 267 1.66 4.28 3.31 6.60 3.35 1.00 3.35 1.22 1.00 7.92 5.79 1.26 0. 19 1.59 0.04 4.50 6.73 -2.16 1.13 2.44 4.67 1.28 7.93 7.06 1.27 1 46 18 1.61 2.13 4.71 5.40 -1.95 .0.20 0.39 3.80 0.04 Average 6.66 5.60 Sum -6.44 32.15 38.16 Calculation of Average Return Correl. Coeffici Calculation of Correlation Coefficient -0.1839 Using Formula Using EXCEL Cell Formula Return Period y 8.13 6.67 CORREL (C36:C46, D36:D46) = -0.1839 Correlation Coefficient 8.04 3.21 Using EXCEL Formula D W N 8.31 1.83 5.76 3.30 6.70 7.34 7.95 7.67 3.31 6.60 7.92 5.79 4.50 6.73 7.93 7.06 4.71 5.40 Variance 3.22 3.82 VAR(C36:(46) & VAR(D36:D46) Calculation of Fund Variance St. Dev. 1.79 1.95 VARO.5 Calculation of Fund Standard Deviation Portfolio Variance and Standard Deviation o' xy = hxox+ hyo'y + 2[h,hy CORRxy 60] where hx and hy are the weightings of Funds x and y in the PortfolioCorrelation Coefficient [(x-x)(-y) Correlation Coefficient Formula Correlation of Two Funds (x and y) Using Correlation Formula Return Period X-X y-y (x-x)(y-y) (X-x) (y-y) 8.13 6.67 1.47 1.07 1.57 1.14 8.04 3.21 1.38 -2.39 -3.30 1.90 5.71 8.31 1.83 1.65 -3.77 -6.22 2.72 14.21 5.76 3.30 -0.90 -2.30 2.07 0.81 5.29 6,70 7.34 0.04 174 0 07 0.00 3.03 7.95 7.67 1.29 2.07 2.67 1.66 4,28 3.31 6.60 -3.35 1.00 3.35 11.22 1.00 7.92 5.79 1.26 0.19 0.24 1.59 0.04 4.50 6.73 -2.16 1.13 -2.44 4.67 1.28 7.93 7.06 1.27 1.46 1.85 1.61 2.13 4.71 5.40 -1.95 -0.20 039 3.80 0.04 Average 6.66 5.60 Sum -6.44 32.15 38.16 Calculation of Average Return Correl. Coeffici Calculation of Correlation Coefficient =-0.1839 Using Formula Using EXCEL Cell Formula Return Period 8.13 6.67 CORREL (C36:(46, D36:D46) = -0.1839 Correlation Coefficient 8.04 3.21 Using EXCEL Formula A W N 8.31 1.83 5.76 3.30 6.70 7.34 7.95 7 67 3.31 6.60 7.92 5.79 4.50 6.73 7.93 7.06 4.71 5.40 Variance 3.22 3.82 VAR(C36:C46) & VAR(D36:D46) Calculation of Fund Variance St. Dev 1.79 1.95 VAROS Calculation of Fund Standard Deviation Portfolio Variance and Standard Deviation o' xy= hxox+ hyo"y+ 2[h,h, CORRxy 60] where hy and hy are the weightings of Funds x and y in the Portfolio Portfolio Performance Based on Weigting of Holdings Portfolio Holding (h) Return Portfolio Portfolio Holding (h) Return Portfolio Variance St. Dev. Variance St. Dev 100% 6.66% 1,79 50 % 50 % 6.13% 1.44 1,20 95% 6.61% 2.85 1.69 45% 55% 6.08% 1.49 1.22 90% 10% 6.55% 2.53 1.59 40%% 60% 6.02% 1.58 1.26
Step by Step Solution
There are 3 Steps involved in it
1 Expert Approved Answer
Step: 1 Unlock
Question Has Been Solved by an Expert!
Get step-by-step solutions from verified subject matter experts
Step: 2 Unlock
Step: 3 Unlock
Students Have Also Explored These Related Finance Questions!