

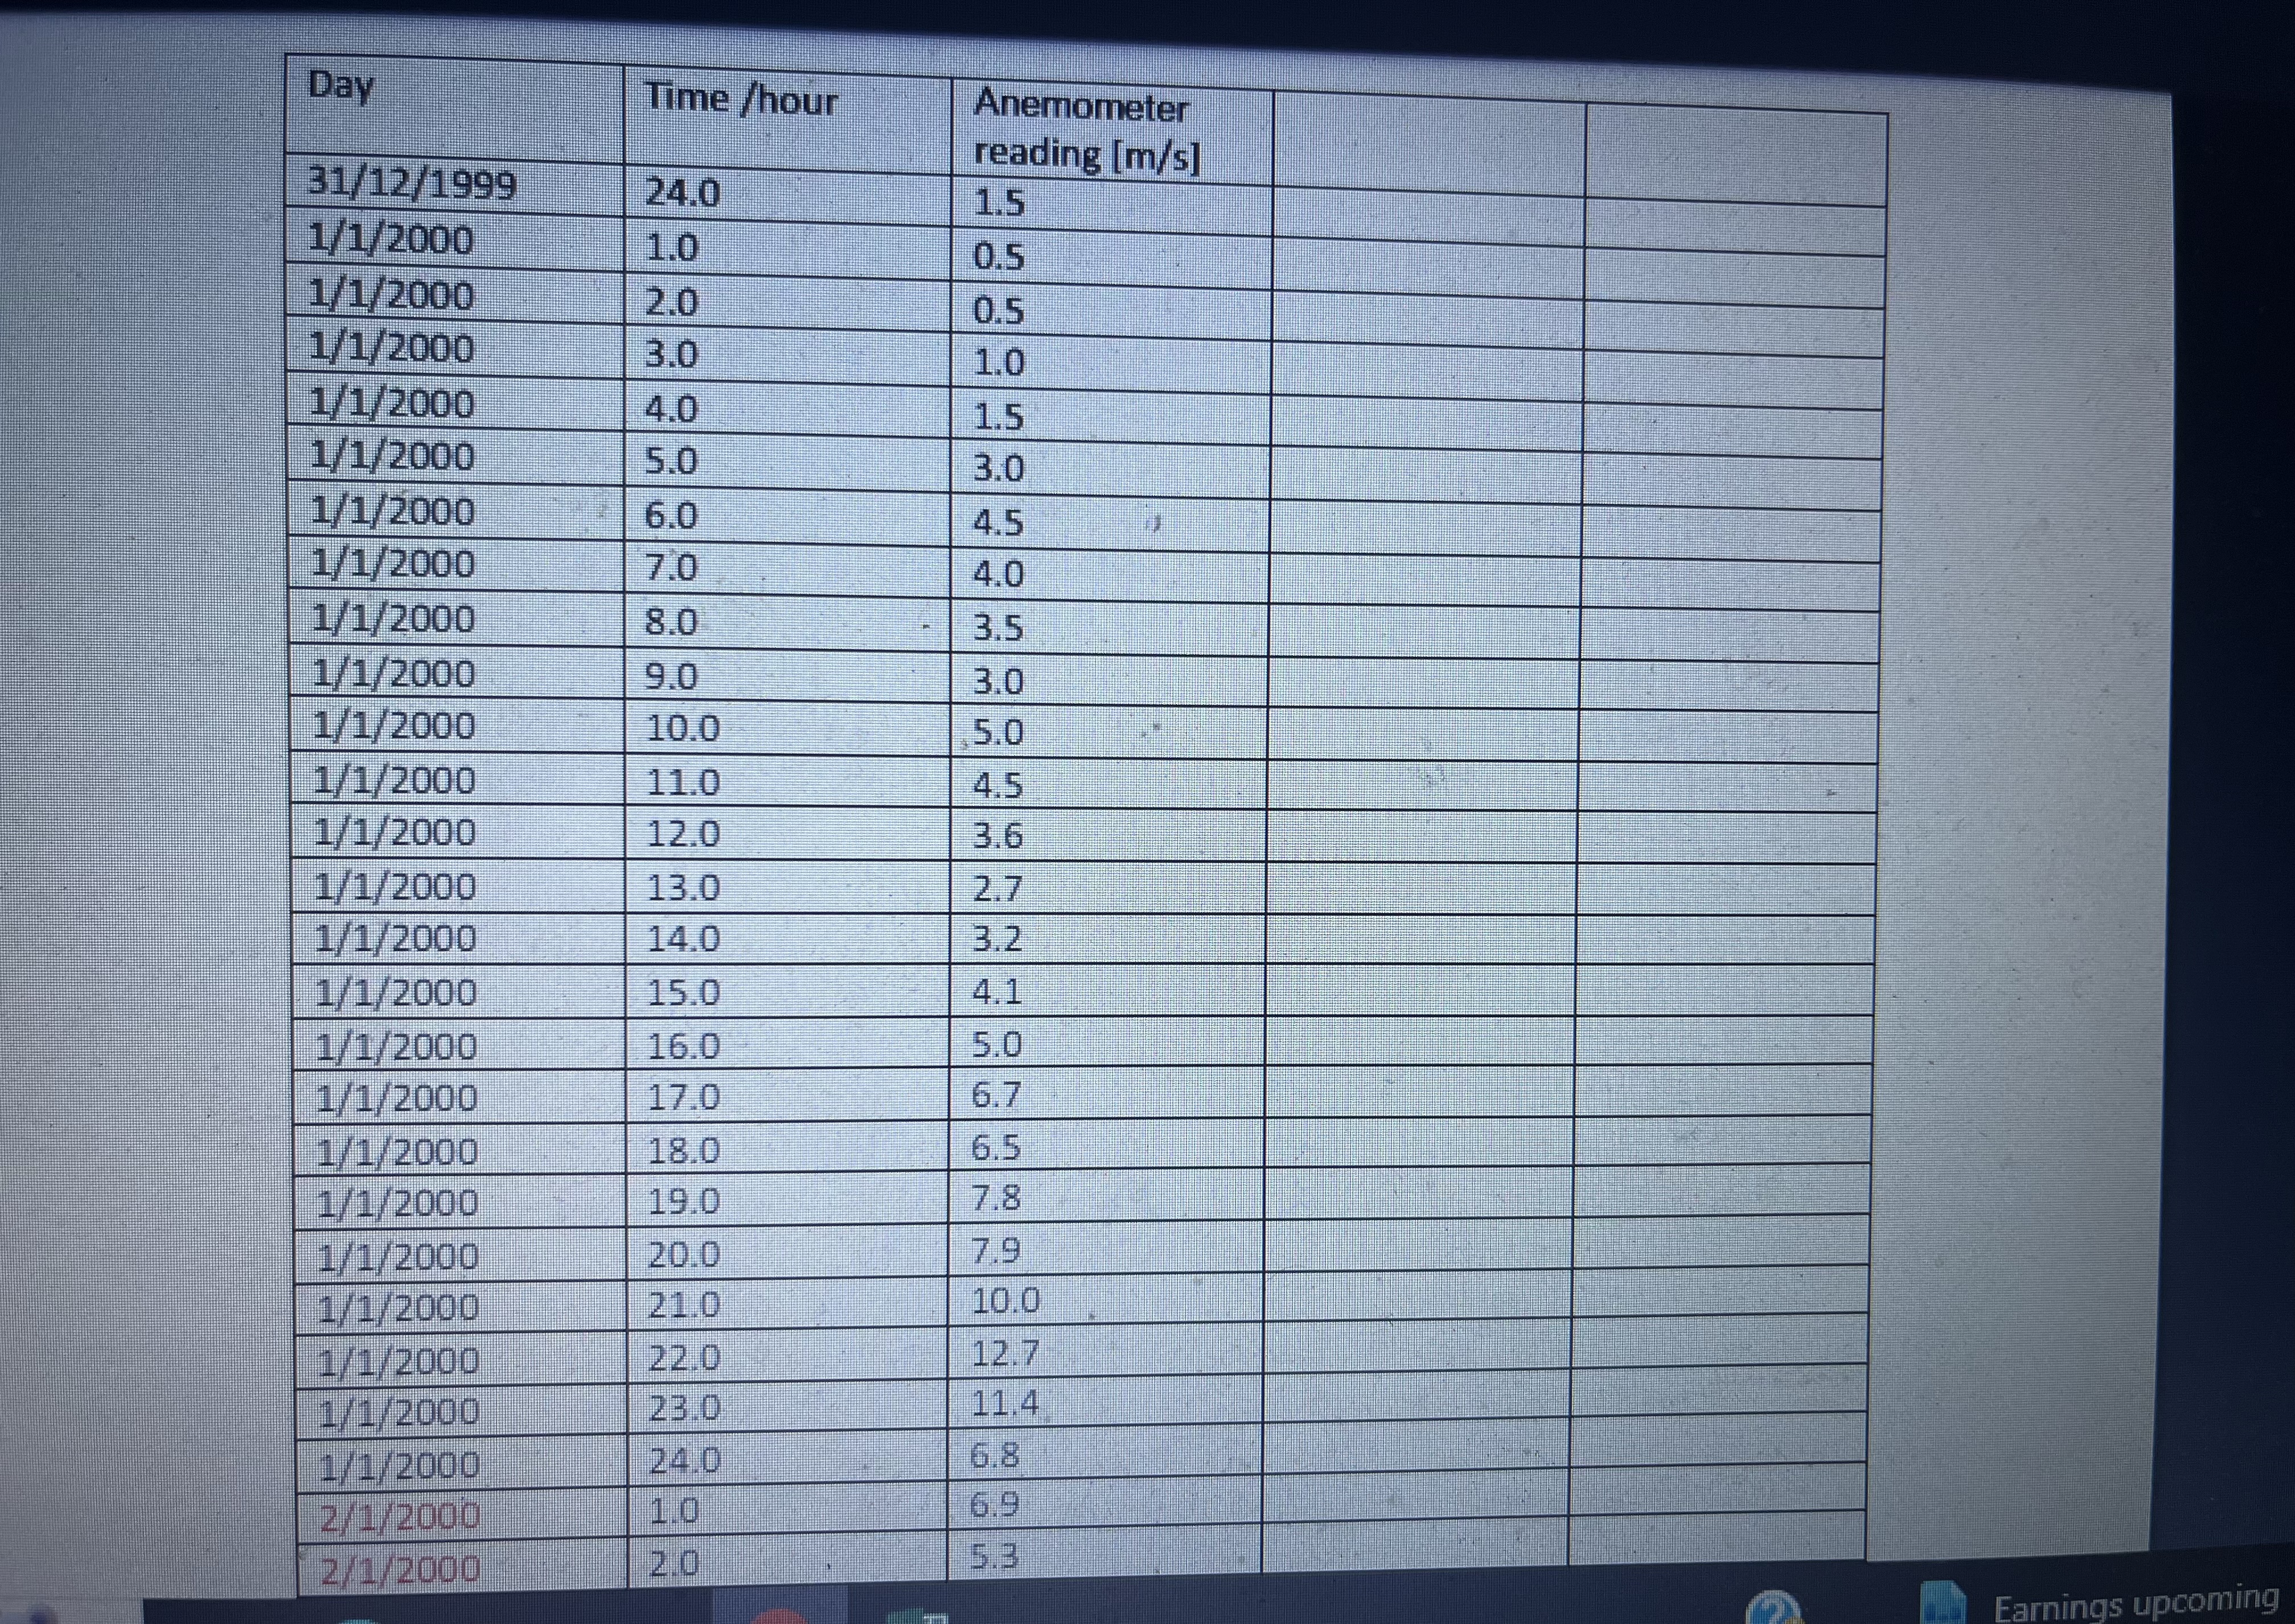
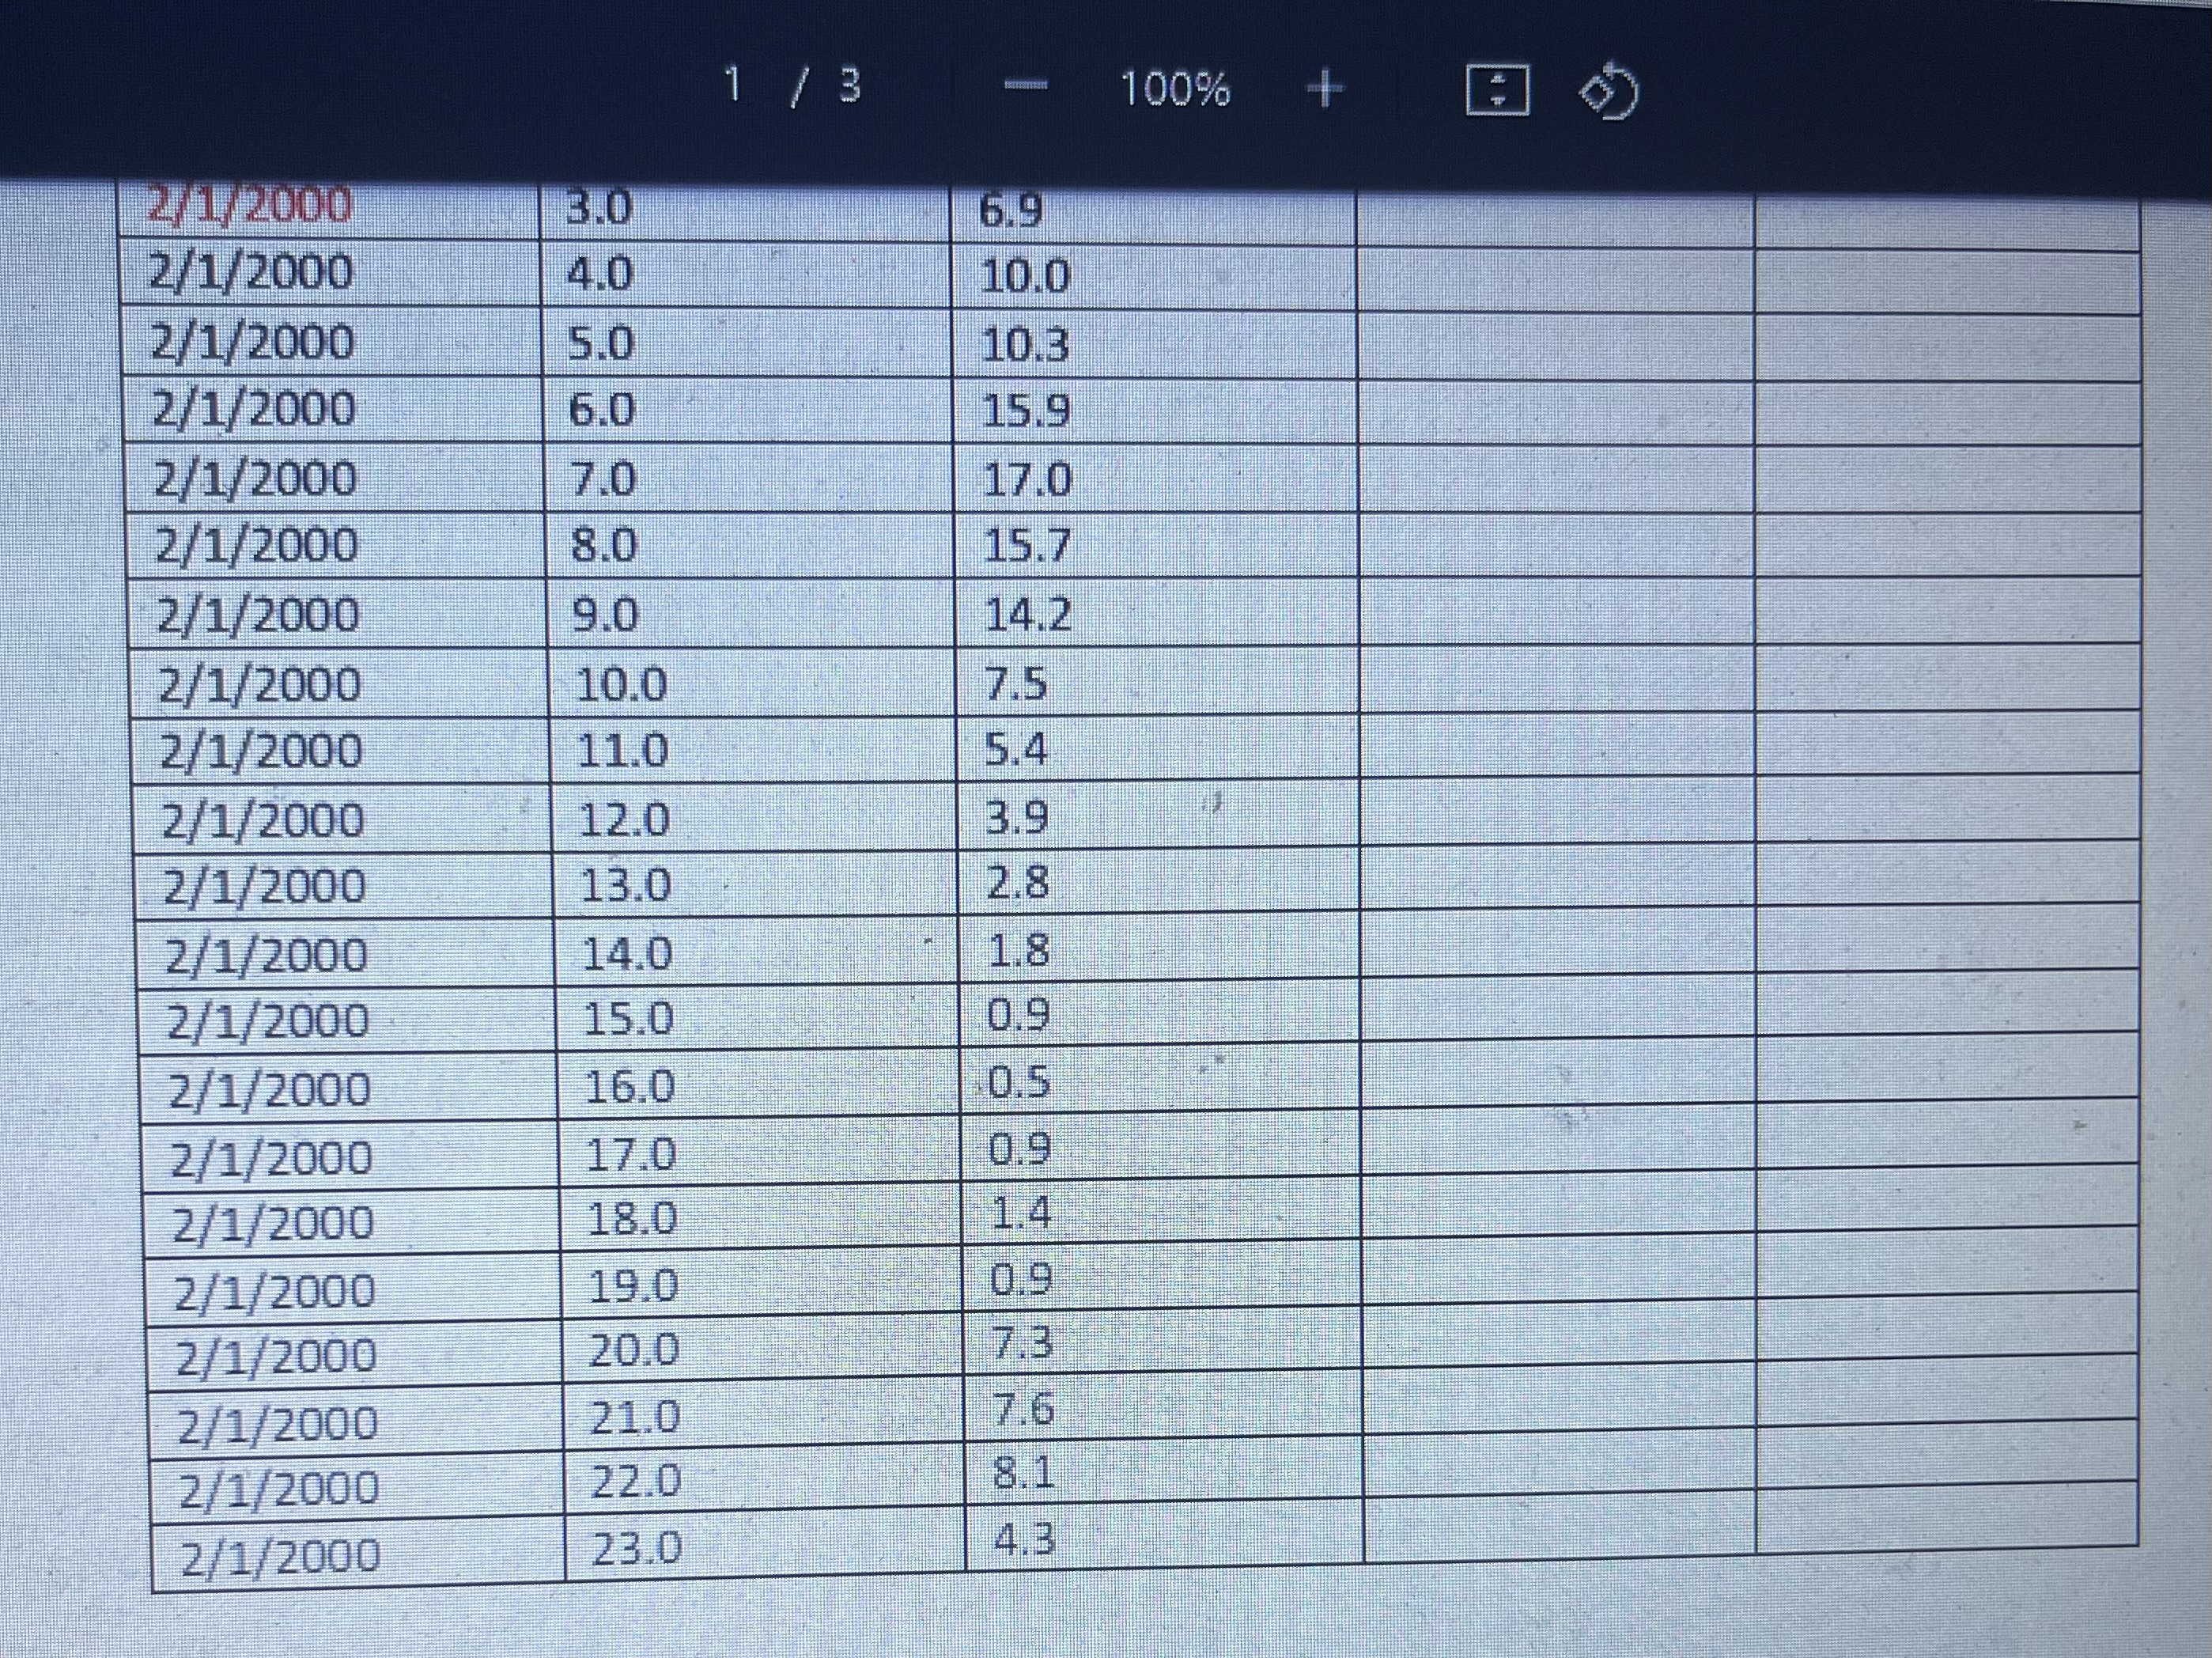
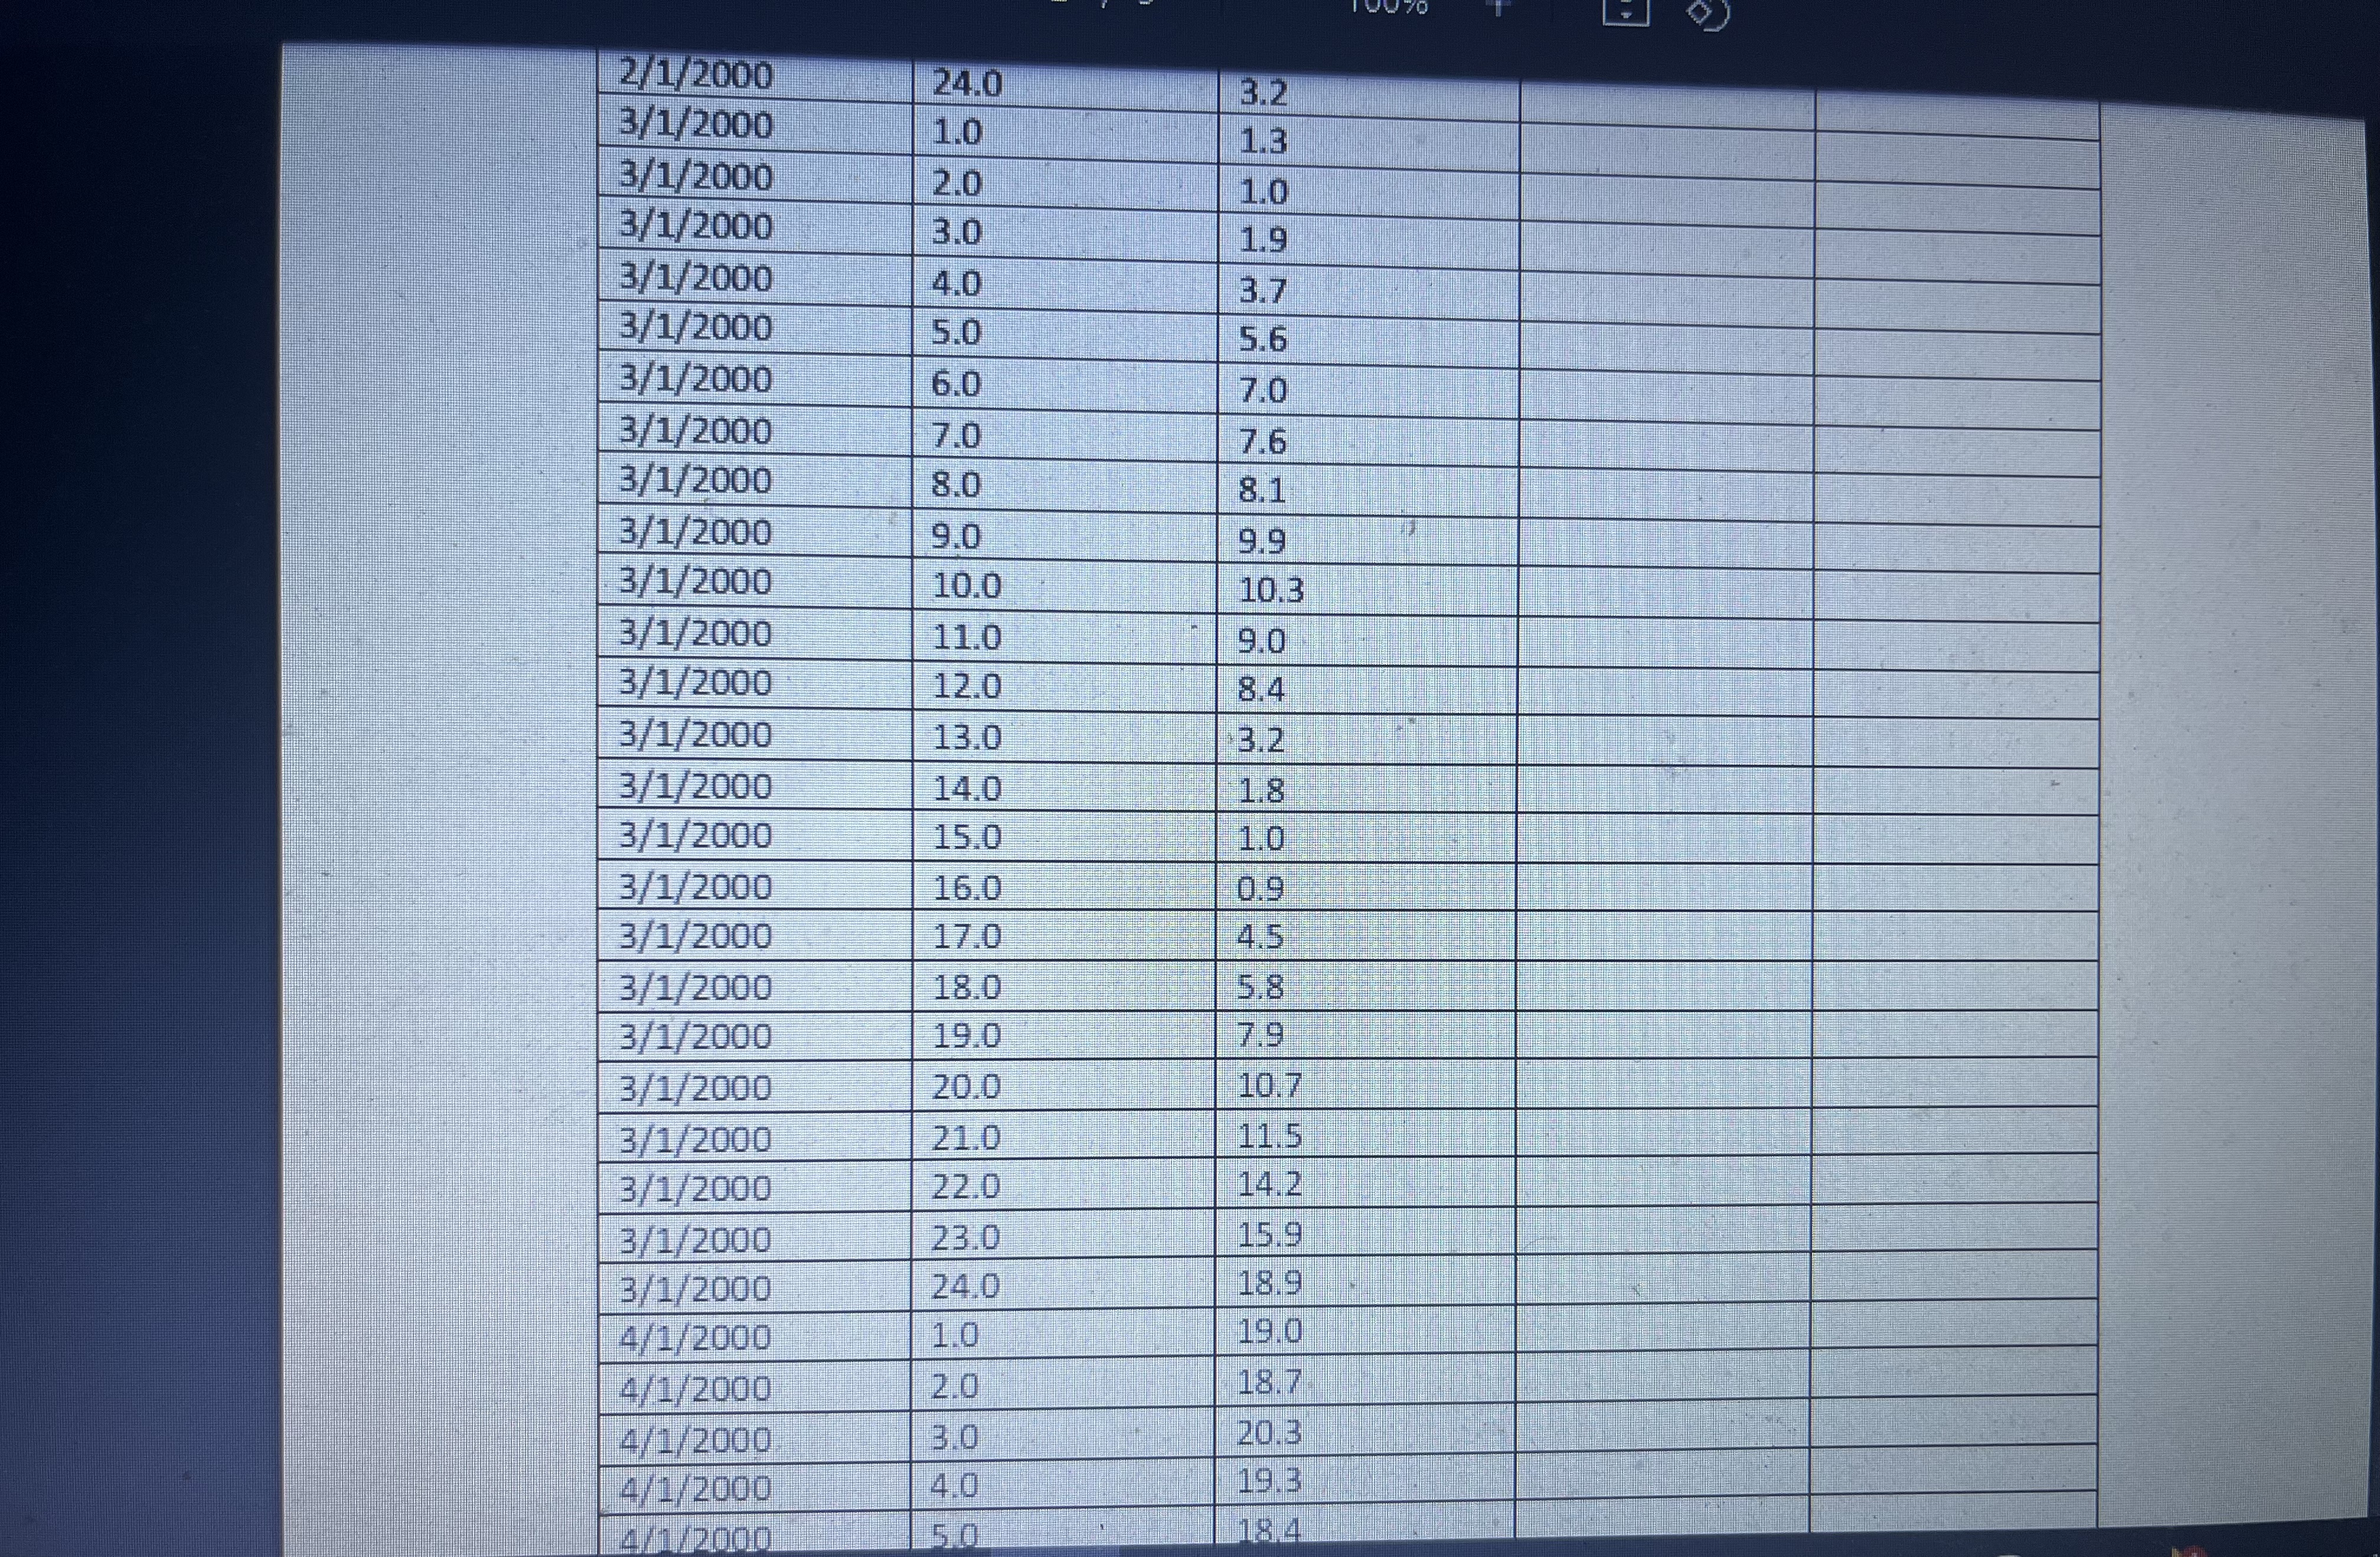
Question: The attached data sheet is an anemometer hourly readings for a certain site. The readings cover the first four days of the year 2000. The
The attached data sheet is an anemometer hourly readings for a certain site. The readings cover the first four days of the year 2000. The data has been taken for a certain direction. Objectives I- Plot: 1. The histogram of the wind. [10] 2. The relative frequency distribution [10] 3. Rayleigh distribution [15] 4. Weibull distribution [15] Discuss the suitable model. [5] II- Find the wind velocity that corresponds to most probable kinetic energy in terms of the average velocity, and its value. [15] III- Discuss the variation of wind speed and show the suitability of the location for a wind turbine. [10] IV- Find the gross wind energy.[10] V- Use the results for power consideration (Can you estimate the power?).[10]
![1. The histogram of the wind. [10] 2. The relative frequency distribution](https://s3.amazonaws.com/si.experts.images/answers/2024/07/6688619c59f20_9156688619bf2167.jpg)
![[10] 3. Rayleigh distribution [15] 4. Weibull distribution [15] Discuss the suitable](https://s3.amazonaws.com/si.experts.images/answers/2024/07/6688619d16545_9166688619caf5ba.jpg)
Step by Step Solution
There are 3 Steps involved in it

Get step-by-step solutions from verified subject matter experts