

Question: The attached file is a compiled script. The independent variable is trust, whether the respondent believes others can be trusted. The dependent variable is physhlth,
The attached file is a compiled script. The independent variable is trust, whether the respondent believes others can be trusted. The dependent variable is physhlth, the number of poor health days the respondent has had in the last 30 days. We are testing whether trusting others has a relationship with how healthy or sick people feel.
Review the attached output from R studio and summarize the results, making sure to answer the following questions:
- How do the distributions compare across the two groups in terms of means, medians, and standard deviations?
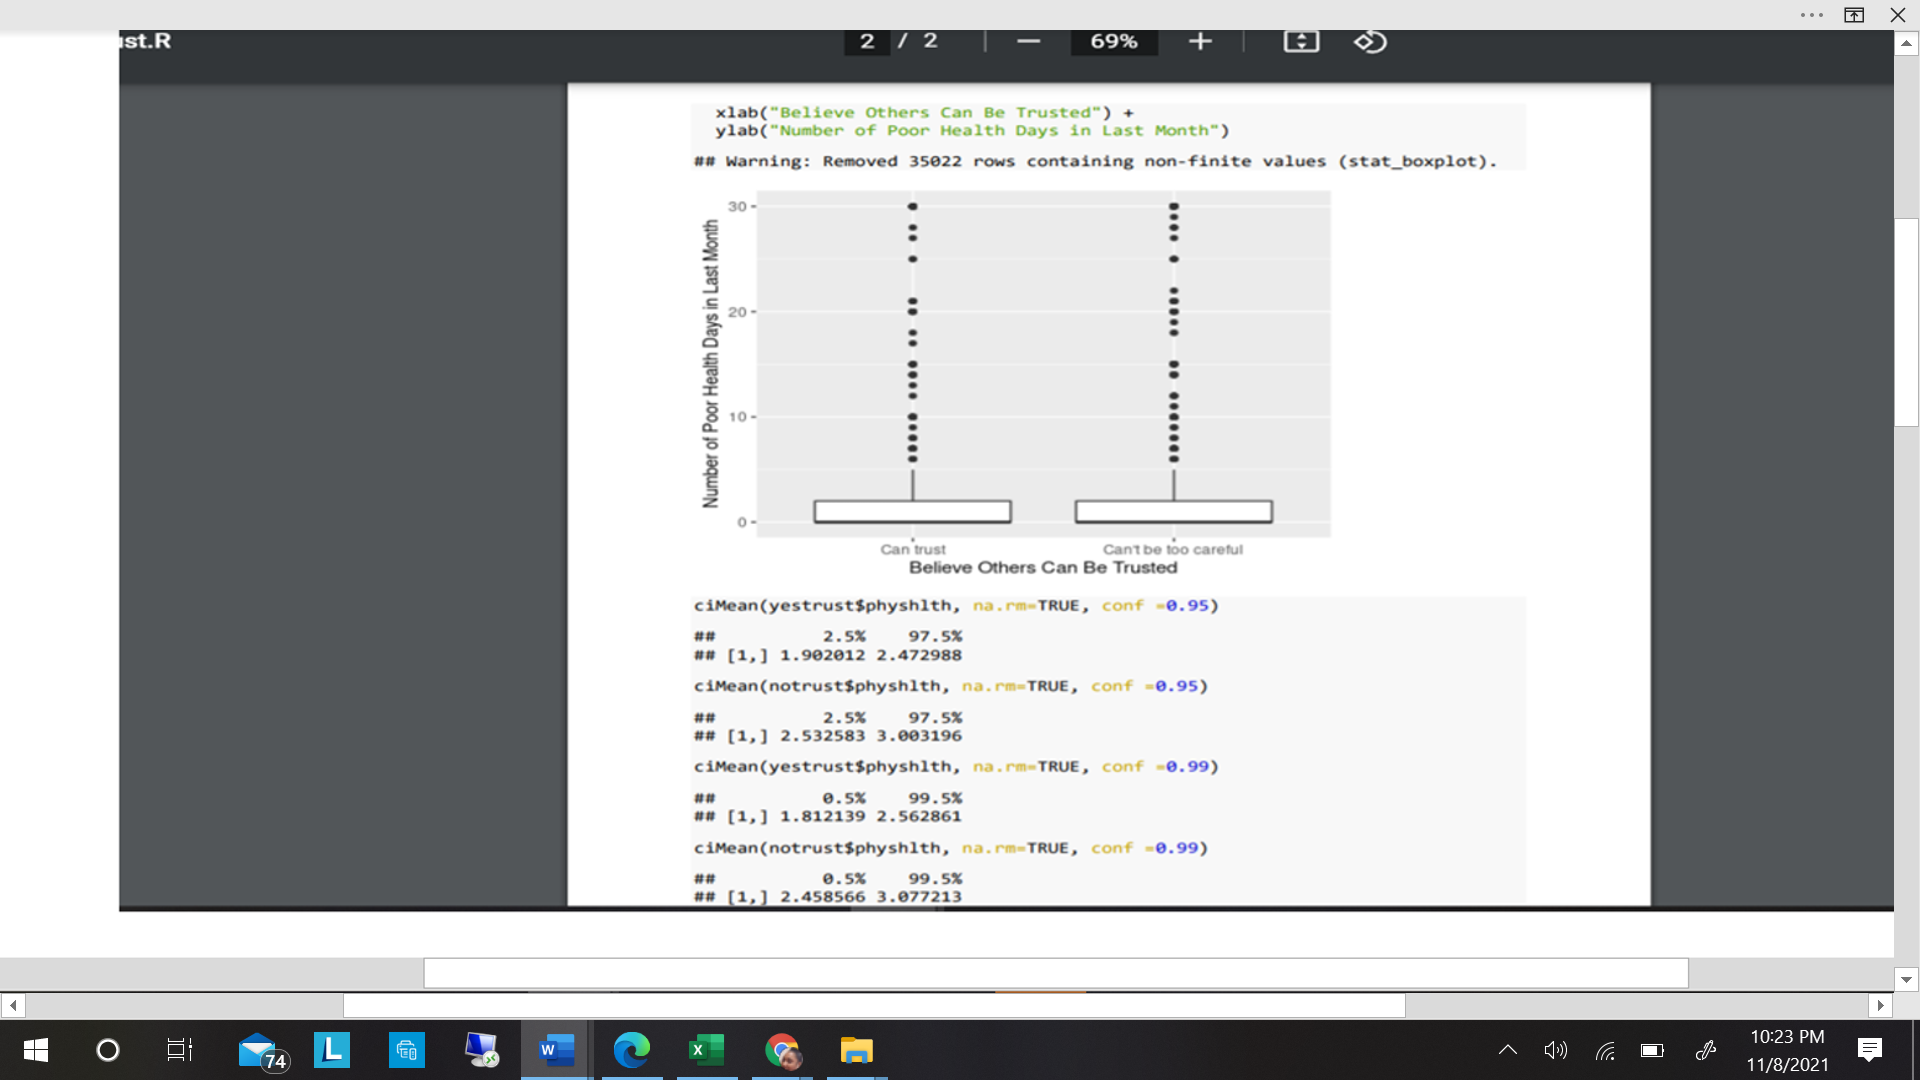
- How do the boxplots compare across the two groups?
- Based on the 95% and 99% CIs, can you conclude there is a relationship between the independent and dependent variable? Why or why not?
PLEASE PLEASE, REALLY NEED SOME HELP WITH THIS ASSIGNMENT
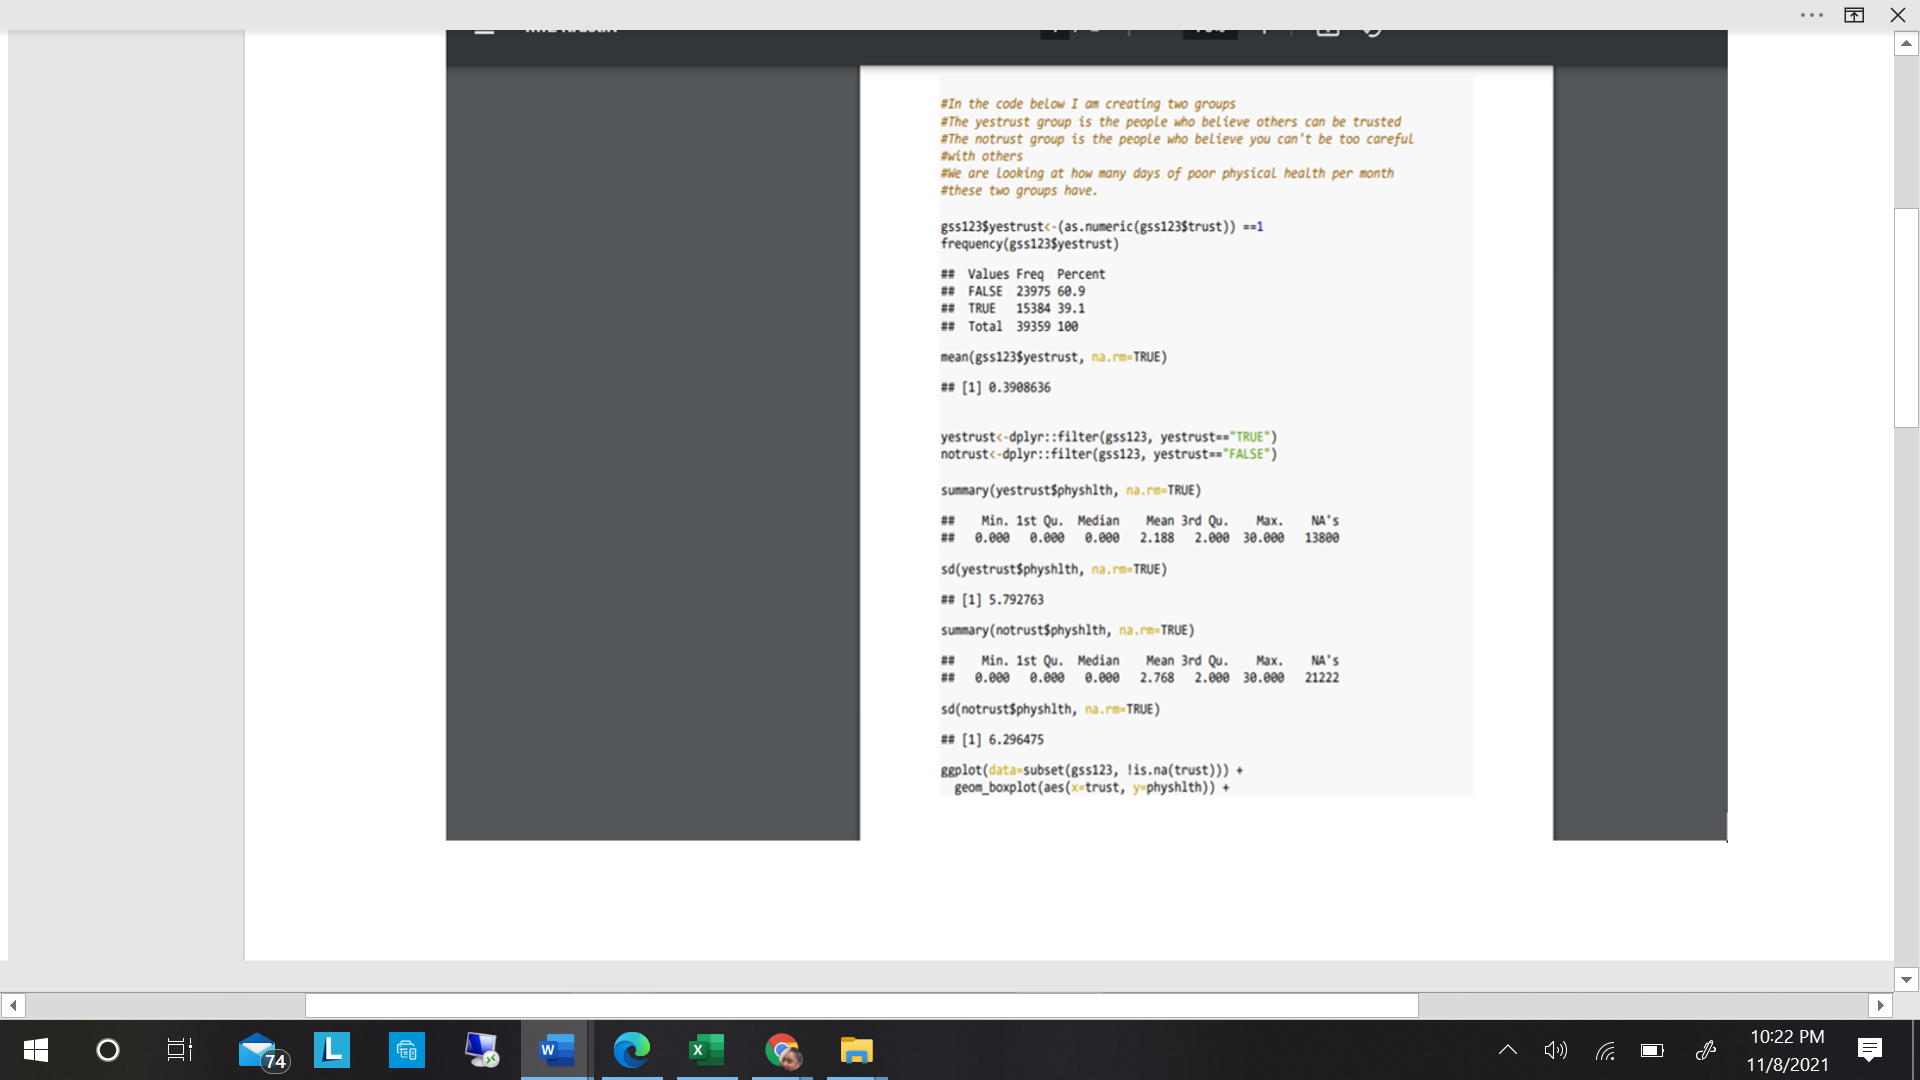
. . . X #In the code below I am creating two groups #The yestrust group is the people who believe others can be trusted #The notrust group is the people who believe you can't be too careful #with others #We are Looking at how many days of poor physical health per month #these two groups have. gss123$yestrust
Step by Step Solution
There are 3 Steps involved in it

Get step-by-step solutions from verified subject matter experts