

Question: The attached graph ( A, B, C, D, E) are used to answer the questions in the second picture. Please help to solve A) (B)
The attached graph ( A, B, C, D, E) are used to answer the questions in the second picture. Please help to solve
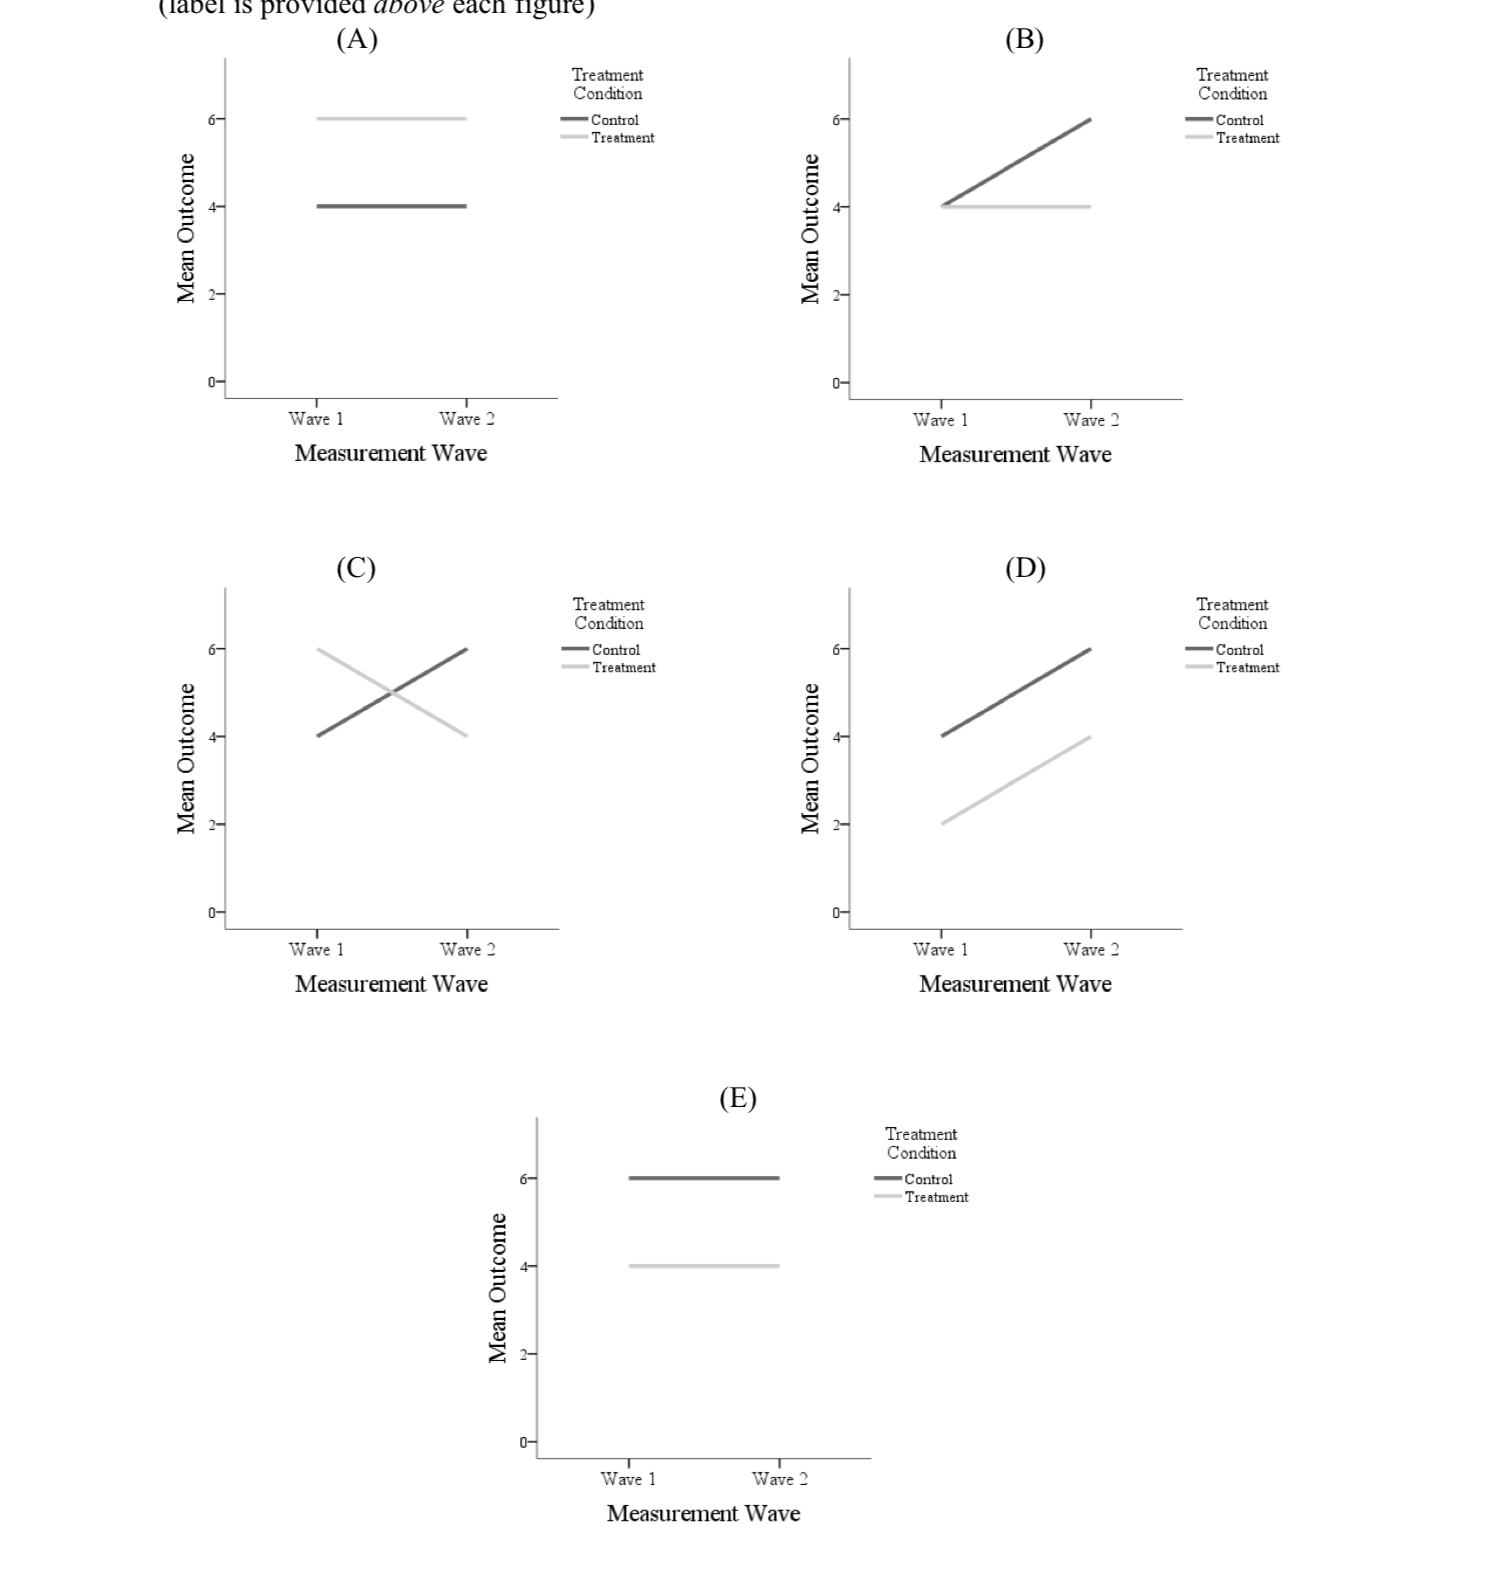
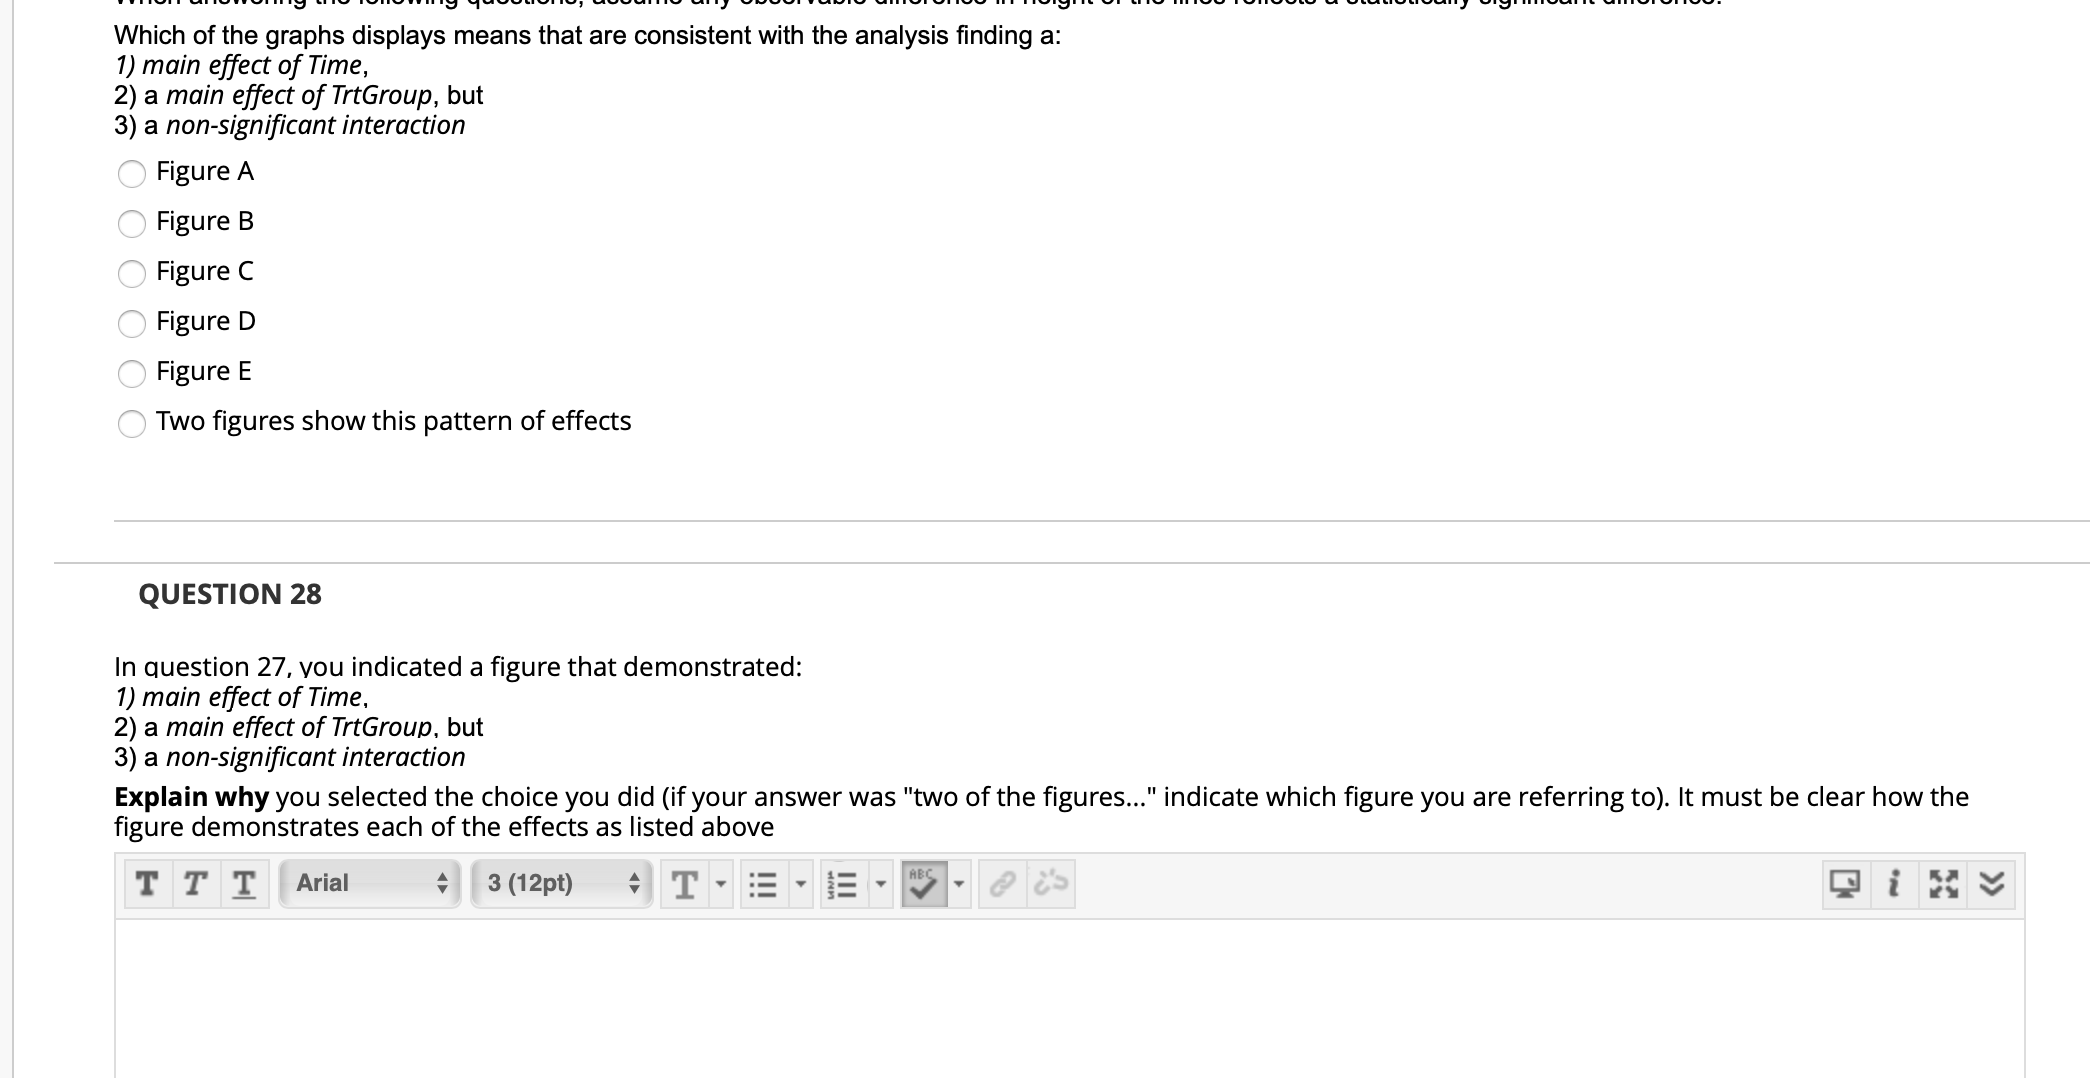
A) (B) Treatment Treatment Condition Condition 6- - Control - Control Treatment Treatment Mean Outcome 2 - Mean Outcome 0- Wave 1 Wave 2 Wave 1 Wave 2 Measurement Wave Measurement Wave (C) (D) Treatment Treatment Condition Condition 6 - X - Control - Control Treatment Treatment Mean Outcome 2 - Mean Outcome 2 - Wave 1 Wave 2 Wave 1 Wave 2 Measurement Wave Measurement Wave (E) Treatment Condition 6- -Control Treatment Mean Outcome Wave 1 Wave 2 Measurement WaveWhich of the graphs displays means that are consistent with the analysis finding a: 1) main effect of Time, 2) a main effect of TrtGroup, but 3) a non-significant interaction Figure A Figure B Figure C Figure D Figure E Two figures show this pattern of effects QUESTION 28 In question 27, you indicated a figure that demonstrated: 1) main effect of Time, 2) a main effect of TrtGroup, but 3) a non-significant interaction Explain why you selected the choice you did (if your answer was "two of the figures..." indicate which figure you are referring to). It must be clear how the figure demonstrates each of the effects as listed above TTT Arial 3 (12pt) THE IE ABC
Step by Step Solution
There are 3 Steps involved in it

Get step-by-step solutions from verified subject matter experts