

Question: The attached spreadsheet PS2 data (see photo) contains the time series of monthly market capitalization and return of the S& P 500 Stock Index and
The attached spreadsheet "PS2 data" (see photo) contains the time series of monthly market capitalization and return of the S& P 500 Stock Index and the S&P 500 Investment Grade bond Index.
[a] What are your estimates of the annualized expected return and volatility of each index? (5pt)
[b] Calculate the time-series monthly returns of the following three strategies (5pt):
- A market-value-weighted portfolio of the stock and bond index.
- A risk-parity strategy based on your answer in a.
- A 60% stock and 40% bond rule-of-thumb strategy.
[c] What is your estimate of the Sharpe ratio of each strategy during the sample period, assuming that the risk-free rate is 1%? (5pt)
[d] Compare the performance of the three strategies during the early stage of the covid crisis in March 2020, what is the difference? explain why there is the difference. (5pt)
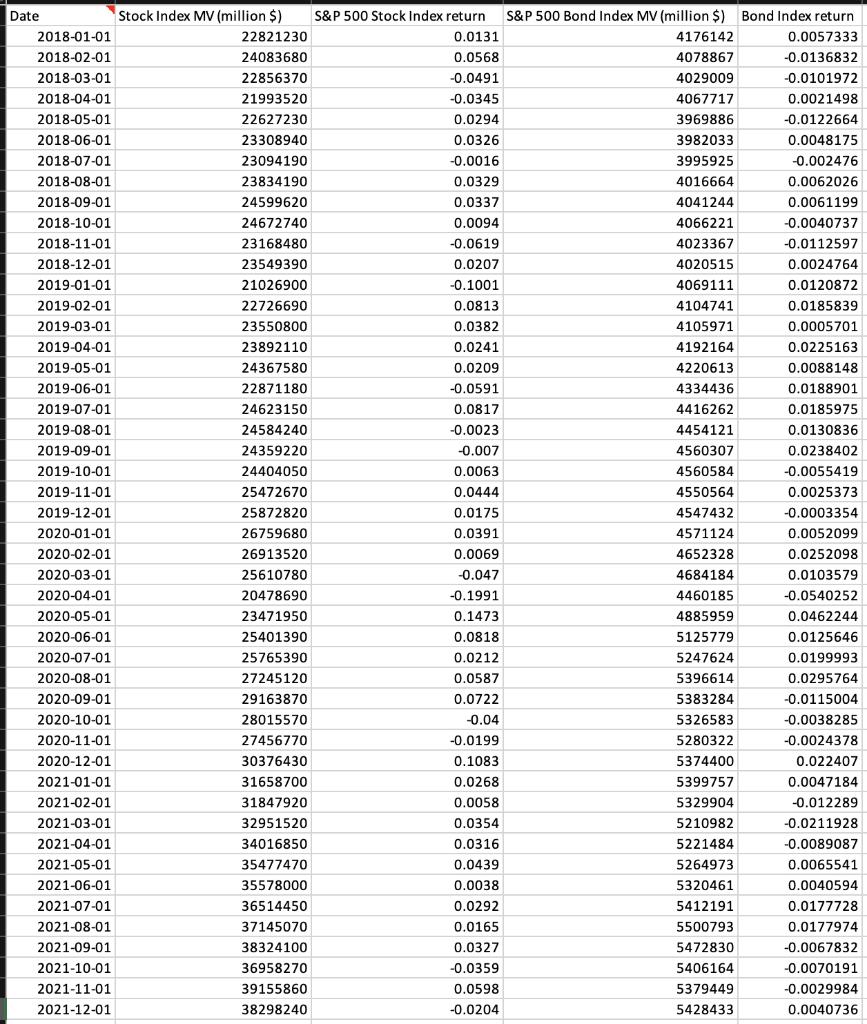
Date 2018-01-01 2018-02-01 2018-03-01 2018-04-01 2018-05-01 2018-06-01 2018-07-01 2018-08-01 2018-09-01 2018-10-01 2018-11-01 2018-12-01 2019-01-01 2019-02-01 2019-03-01 2019-04-01 2019-05-01 2019-06-01 2019-07-01 2019-08-01 2019-09-01 2019-10-01 2019-11-01 2019-12-01 2020-01-01 2020-02-01 2020-03-01 2020-04-01 2020-05-01 2020-06-01 2020-07-01 2020-08-01 2020-09-01 2020-10-01 2020-11-01 2020-12-01 2021-01-01 2021-02-01 2021-03-01 2021-04-01 2021-05-01 2021-06-01 2021-07-01 2021-08-01 2021-09-01 2021-10-01 2021-11-01 2021-12-01 Stock Index MV (million $) 22821230 24083680 22856370 21993520 22627230 23308940 23094190 23834190 24599620 24672740 23168480 23549390 21026900 22726690 23550800 23892110 24367580 22871180 24623150 24584240 24359220 24404050 25472670 25872820 26759680 26913520 25610780 20478690 23471950 25401390 25765390 27245120 29163870 28015570 27456770 30376430 31658700 31847920 32951520 34016850 35477470 35578000 36514450 37145070 38324100 36958270 39155860 38298240 S&P 500 Stock Index return 0.0131 0.0568 -0.0491 -0.0345 0.0294 0.0326 -0.0016 0.0329 0.0337 0.0094 -0.0619 0.0207 -0.1001 0.0813 0.0382 0.0241 0.0209 -0.0591 0.0817 -0.0023 -0.007 0.0063 0.0444 0.0175 0.0391 0.0069 -0.047 -0.1991 0.1473 0.0818 0.0212 0.0587 0.0722 -0.04 -0.0199 0.1083 0.0268 0.0058 0.0354 0.0316 0.0439 0.0038 0.0292 0.0165 0.0327 -0.0359 0.0598 -0.0204 S&P 500 Bond Index MV (million $) Bond Index return 0.0057333 -0.0136832 -0.0101972 0.0021498 -0.0122664 0.0048175 -0.002476 0.0062026 0.0061199 -0.0040737 -0.0112597 4176142 4078867 4029009 4067717 3969886 3982033 3995925 4016664 4041244 4066221 4023367 4020515 4069111 4104741 4105971 4192164 4220613 4334436 4416262 4454121 4560307 4560584 4550564 4547432 4571124 4652328 4684184 4460185 4885959 5125779 5247624 5396614 5383284 5326583 5280322 5374400 5399757 5329904 5210982 5221484 5264973 5320461 5412191 5500793 5472830 5406164 5379449 5428433 0.0024764 0.0120872 0.0185839 0.0005701 0.0225163 0.0088148 0.0188901 0.0185975 0.0130836 0.0238402 -0.0055419 0.0025373 -0.0003354 0.0052099 0.0252098 0.0103579 -0.0540252 0.0462244 0.0125646 0.0199993 0.0295764 -0.0115004 -0.0038285 -0.0024378 0.022407 0.0047184 -0.012289 -0.0211928 -0.0089087 0.0065541 0.0040594 0.0177728 0.0177974 -0.0067832 -0.0070191 -0.0029984 0.0040736
Step by Step Solution
3.52 Rating (162 Votes )
There are 3 Steps involved in it
a I estimate that the annualized expected return of the SP 500 stock index is 95 and the annualized expected return of the SP 500 Investment Grade bon... View full answer

Get step-by-step solutions from verified subject matter experts