

Question: The average final exam score for the statistics course is 3596. A professor wants to see if the average final exam score for students who
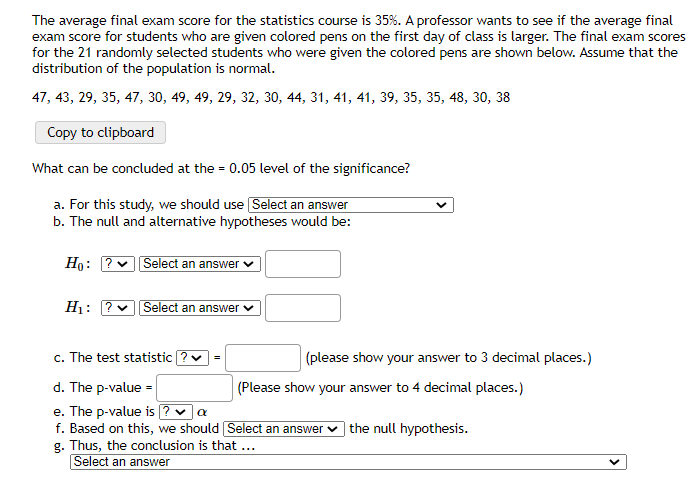
The average final exam score for the statistics course is 3596. A professor wants to see if the average final exam score for students who are given colored pens on the rst day of class is larger: The nal exam scores for the 21 randomly selected students who were given the colored pens are shown below. Assume that the distribution of the population is normal. 4?, 43, 29, 35, 4?, 30, 49, 49, 29, 32, 30, 44, 31, 41, 41, 39, 35, 35, 48, 30, 38 Copy to clipboard 1I.I'll'hat can be concluded at the = 0.05 level of the significance? a. For this study, we should use Select an answer v b. The null and alternative hypotheses would be: Ha: -:] c. The test statistic = :1 {please show your answer to 3 decimal planes] d. The p-value = [:1 {Please show your answer to 4 decimal places.) e. The p-value is :1 f. Based on this, we should the null hypothesis. g. Thus, the conclusion is that Select an answer v
Step by Step Solution
There are 3 Steps involved in it

Get step-by-step solutions from verified subject matter experts