

Question: The average Math SAT score for a certain year was 540 with a standard deviation of 60. Assume that the distribution follows the normal curve.a)
The average Math SAT score for a certain year was 540 with a standard deviation of 60. Assume that the distribution follows the normal curve.a) Find the percentage of students who scored higher than 650.b) Find the percentage of students who scored between 480 and 700.c) Suppose that a student scored higher than 80% of the student population. What was his score?
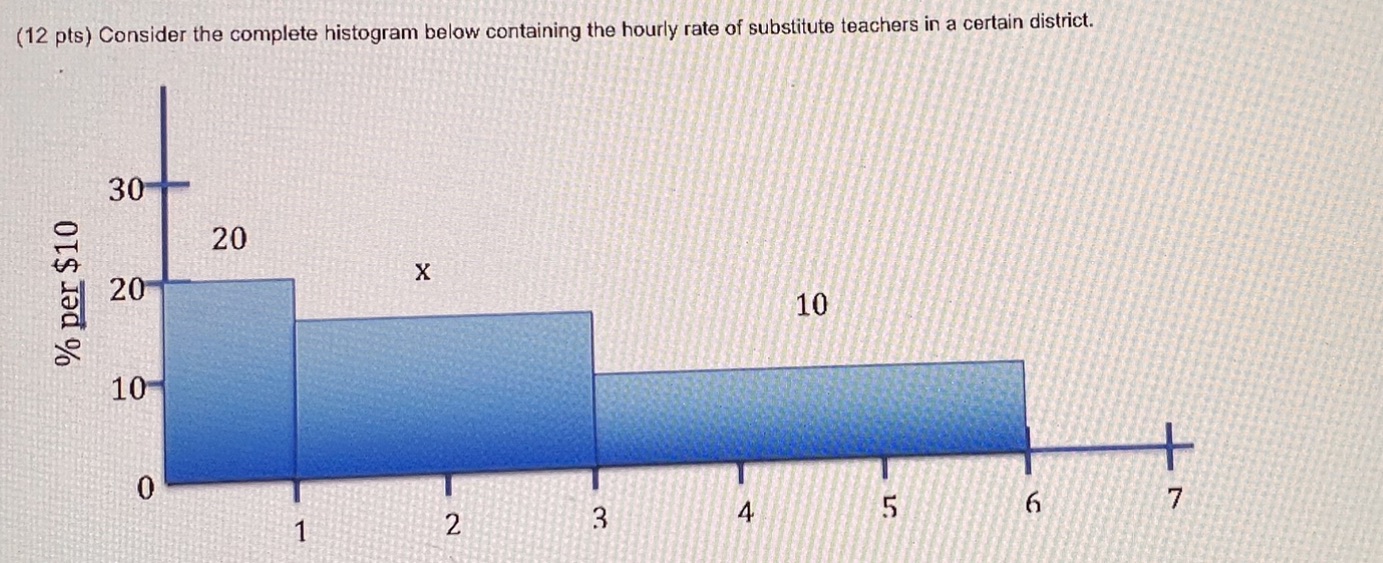
(12 pts) Consider the complete histogram below containing the hourly rate of substitute teachers in a certain district. 30 20 20 X % per $10 10 10 0 JT W 4 6 N
Step by Step Solution
There are 3 Steps involved in it
1 Expert Approved Answer
Step: 1 Unlock

Question Has Been Solved by an Expert!
Get step-by-step solutions from verified subject matter experts
Step: 2 Unlock
Step: 3 Unlock