

Question: The balance sheet, income statement, and cash flow statement from the most recent fiscal quarter The Ratios Most Recent Fiscal Qtr worksheet in the Project
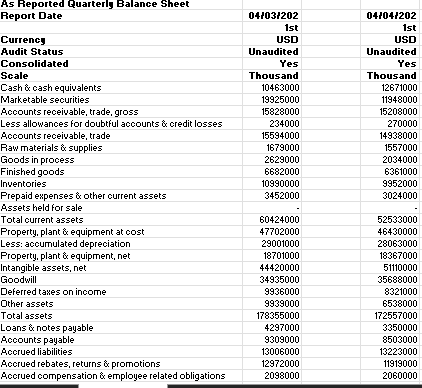
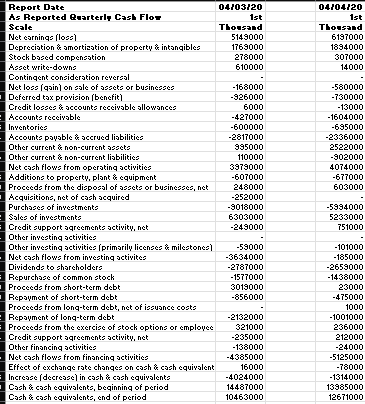
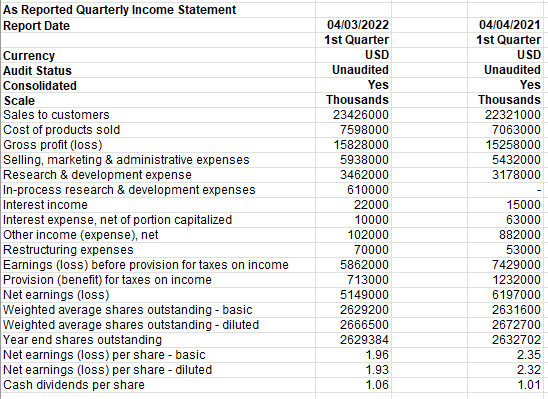
The balance sheet, income statement, and cash flow statement from the most recent fiscal quarter
The Ratios Most Recent Fiscal Qtr worksheet in the Project Two Financial Formulas workbook.
For example, if the most recent fiscal quarter available is the third quarter in 2022, youll compare those results to the same financial calculations from the third quarter in 2021.
Use the documents to calculate key financial ratios.
Then open the following documents:
The balance sheet, income statement, and cash flow statement from the same fiscal quarter one year ago
The Ratios Same Fiscal Qtr 1 Year Ago worksheet
Use the documents to calculate the same financial ratios. Finally, compare those ratios and analyze your results.
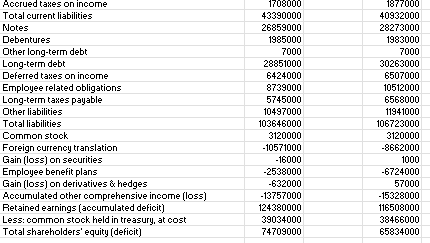
\begin{tabular}{|l|r|r|} \hline Total current liabilities & 1708000 & 1877000 \\ \hline Notes & 4330000 & 40932000 \\ \hline Debentures & 26859000 & 28273000 \\ \hline Dther long-term debt & 1985000 & 1983000 \\ \hline Long-term debt & 7000 & 7000 \\ \hline Deferred tapes on income & 28851000 & 30263000 \\ \hline Employee related obligations & 6424000 & 6507000 \\ \hline Long-term tapes payable & 8739000 & 10512000 \\ \hline Dther liabilities & 5745000 & 6568000 \\ \hline Total liabilities & 10497000 & 11941000 \\ \hline Common stook & 103646000 & 106723000 \\ \hline Foreign currency translation & 3120000 & 3120000 \\ \hline Gain (loss) on securities & 10571000 & 8662000 \\ \hline Employee benefit plans & 16000 & 1000 \\ \hline Gain (loss) on derivatives a hedges & 2538000 & 6724000 \\ \hline Accumulated other comprehensive income (loss) & 13757000 & 57000 \\ \hline Retained earnings (aceumulated deficit) & 124380000 & 15328000 \\ \hline Less: common stock held in treasury, at cost & 39034000 & 116508000 \\ \hline Total shareholders' equity (deficit) & 74709000 & 38466000 \\ \hline \end{tabular} \begin{tabular}{|l|r|r|} \hline As Reported Quarterly Income Statement & \multicolumn{1}{|l|}{} \\ \hline Report Date & 04/03/2022 & 04/04/2021 \\ \hline & 1st Quarter & 1st Quarter \\ \hline Currency & USD & USD \\ \hline Audit Status & Unaudited & Unaudited \\ \hline Consolidated & Yes & Yes \\ \hline Scale & Thousands & Thousands \\ \hline Sales to customers & 23426000 & 22321000 \\ \hline Cost of products sold & 7598000 & 7063000 \\ \hline Gross profit (loss) & 15828000 & 15258000 \\ \hline Selling, marketing \& administrative expenses & 5938000 & 5432000 \\ \hline Research \& development expense & 3462000 & 3178000 \\ \hline In-process research \& development expenses & 610000 & \\ \hline Interest income & 22000 & 15000 \\ \hline Interest expense, net of portion capitalized & 10000 & 63000 \\ \hline Other income (expense), net & 702000 & 882000 \\ \hline Restructuring expenses & 5862000 & 53000 \\ \hline Earnings (loss) before provision for taxes on income & 713000 & 7429000 \\ \hline Provision (benefit) for taxes on income & 5149000 & 1232000 \\ \hline Net earnings (loss) & 2629200 & 6197000 \\ \hline Weighted average shares outstanding - basic & 2666500 & 2631600 \\ \hline Weighted average shares outstanding - diluted & 2629384 & 2672700 \\ \hline Year end shares outstanding & 1.96 & 2632702 \\ \hline Net earnings (loss) per share - basic & 1.93 & 2.35 \\ \hline Net earnings (loss) per share - diluted & 1.06 & 2.32 \\ \hline Cash dividends per share & 1.01 \\ \hline \end{tabular} \begin{tabular}{|l|r|r|} \hline Total current liabilities & 1708000 & 1877000 \\ \hline Notes & 4330000 & 40932000 \\ \hline Debentures & 26859000 & 28273000 \\ \hline Dther long-term debt & 1985000 & 1983000 \\ \hline Long-term debt & 7000 & 7000 \\ \hline Deferred tapes on income & 28851000 & 30263000 \\ \hline Employee related obligations & 6424000 & 6507000 \\ \hline Long-term tapes payable & 8739000 & 10512000 \\ \hline Dther liabilities & 5745000 & 6568000 \\ \hline Total liabilities & 10497000 & 11941000 \\ \hline Common stook & 103646000 & 106723000 \\ \hline Foreign currency translation & 3120000 & 3120000 \\ \hline Gain (loss) on securities & 10571000 & 8662000 \\ \hline Employee benefit plans & 16000 & 1000 \\ \hline Gain (loss) on derivatives a hedges & 2538000 & 6724000 \\ \hline Accumulated other comprehensive income (loss) & 13757000 & 57000 \\ \hline Retained earnings (aceumulated deficit) & 124380000 & 15328000 \\ \hline Less: common stock held in treasury, at cost & 39034000 & 116508000 \\ \hline Total shareholders' equity (deficit) & 74709000 & 38466000 \\ \hline \end{tabular} \begin{tabular}{|l|r|r|} \hline As Reported Quarterly Income Statement & \multicolumn{1}{|l|}{} \\ \hline Report Date & 04/03/2022 & 04/04/2021 \\ \hline & 1st Quarter & 1st Quarter \\ \hline Currency & USD & USD \\ \hline Audit Status & Unaudited & Unaudited \\ \hline Consolidated & Yes & Yes \\ \hline Scale & Thousands & Thousands \\ \hline Sales to customers & 23426000 & 22321000 \\ \hline Cost of products sold & 7598000 & 7063000 \\ \hline Gross profit (loss) & 15828000 & 15258000 \\ \hline Selling, marketing \& administrative expenses & 5938000 & 5432000 \\ \hline Research \& development expense & 3462000 & 3178000 \\ \hline In-process research \& development expenses & 610000 & \\ \hline Interest income & 22000 & 15000 \\ \hline Interest expense, net of portion capitalized & 10000 & 63000 \\ \hline Other income (expense), net & 702000 & 882000 \\ \hline Restructuring expenses & 5862000 & 53000 \\ \hline Earnings (loss) before provision for taxes on income & 713000 & 7429000 \\ \hline Provision (benefit) for taxes on income & 5149000 & 1232000 \\ \hline Net earnings (loss) & 2629200 & 6197000 \\ \hline Weighted average shares outstanding - basic & 2666500 & 2631600 \\ \hline Weighted average shares outstanding - diluted & 2629384 & 2672700 \\ \hline Year end shares outstanding & 1.96 & 2632702 \\ \hline Net earnings (loss) per share - basic & 1.93 & 2.35 \\ \hline Net earnings (loss) per share - diluted & 1.06 & 2.32 \\ \hline Cash dividends per share & 1.01 \\ \hline \end{tabular}
Step by Step Solution
There are 3 Steps involved in it

Get step-by-step solutions from verified subject matter experts