

Question: The ball mill process feed and product samples are tabulated as follows: a. Draw a cumulative graph plot of the data above. b. Define d80
The ball mill process feed and product samples are tabulated as follows:
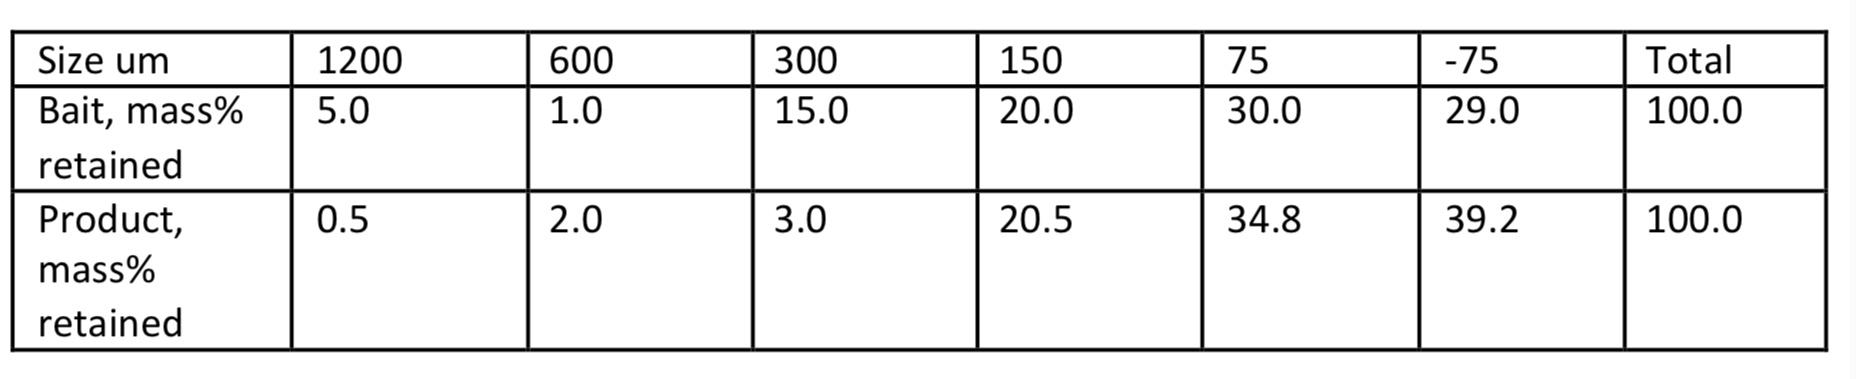
a. Draw a cumulative graph plot of the data above. b. Define d80 feed and product. c. Ball mill process reduction ratio estimation is based on d80.
1200 5.0 600 1.0 300 15.0 150 20.0 75 30.0 -75 29.0 Total 100.0 Size um Bait, mass% retained Product, mass% retained 0.5 2.0 3.0 20.5 34.8 39.2 100.0
Step by Step Solution
There are 3 Steps involved in it
1 Expert Approved Answer
Step: 1 Unlock

Question Has Been Solved by an Expert!
Get step-by-step solutions from verified subject matter experts
Step: 2 Unlock
Step: 3 Unlock