

Question: The bar graph below shows that as costs changed over the decades, a group of people devoted less of their budget to groceries. Percentage
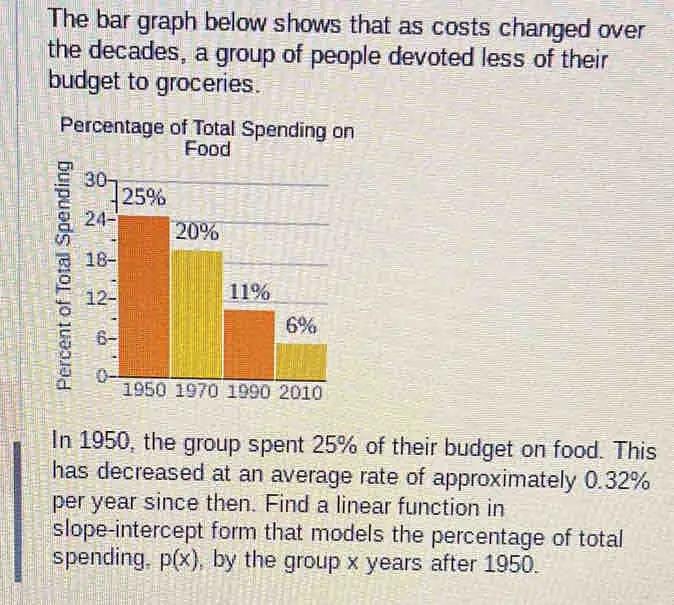
The bar graph below shows that as costs changed over the decades, a group of people devoted less of their budget to groceries. Percentage of Total Spending on Food Percent of Total Spending 30 24- 18- 12- 6- 0- 25% 20% 11% 6% 1950 1970 1990 2010 In 1950, the group spent 25% of their budget on food. This has decreased at an average rate of approximately 0.32% per year since then. Find a linear function in slope-intercept form that models the percentage of total spending, p(x), by the group x years after 1950.
Step by Step Solution
3.48 Rating (155 Votes )
There are 3 Steps involved in it
given In 1950 group spent 22 of their Budget on food this has ... View full answer

Get step-by-step solutions from verified subject matter experts