

Question: The bar graph below was created in R from the mtcars dataset. (The mtcars dataset in built-in to R, you simply have to call it)
The bar graph below was created in R from the mtcars dataset. (The mtcars dataset in built-in to R, you simply have to call it)
Simply recreate this bar graph in R.
You will need to calculate the mean MPG values for cars with different numbers of cylinders and gears.
You will also create error bars that represent +/- 1 standard from the mean.
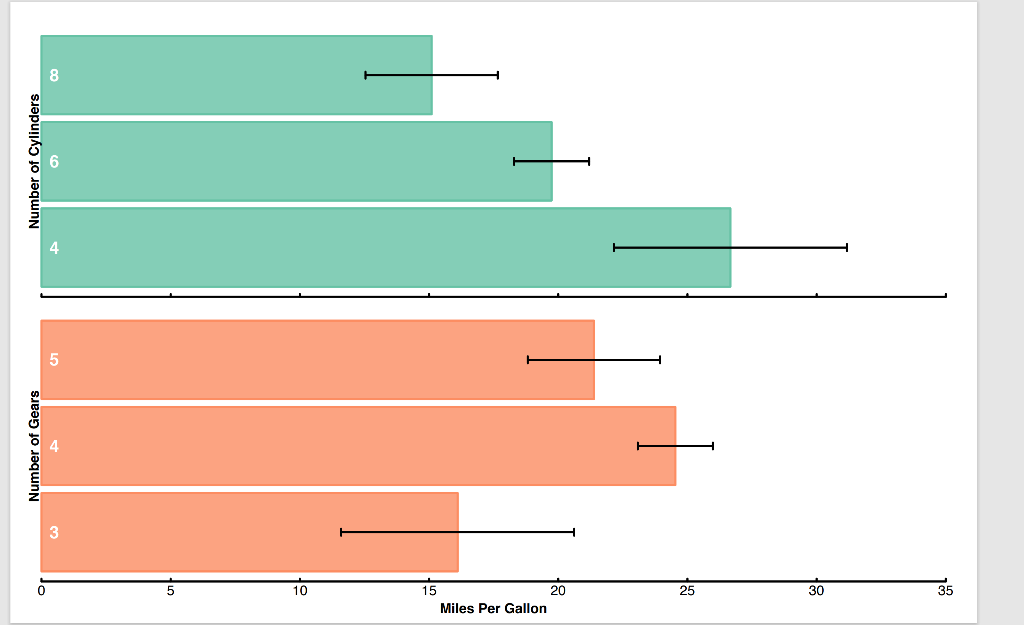
Number of Cylinders 5 Number of Gears 10 15 20 Miles Per Gallon 25 30 35 Number of Cylinders 5 Number of Gears 10 15 20 Miles Per Gallon 25 30 35
Step by Step Solution
There are 3 Steps involved in it
1 Expert Approved Answer
Step: 1 Unlock

Question Has Been Solved by an Expert!
Get step-by-step solutions from verified subject matter experts
Step: 2 Unlock
Step: 3 Unlock