

Question: % The bar graph shows that life expectancy, the number of years newborns are expected to live, in a particular region has increased dramatically
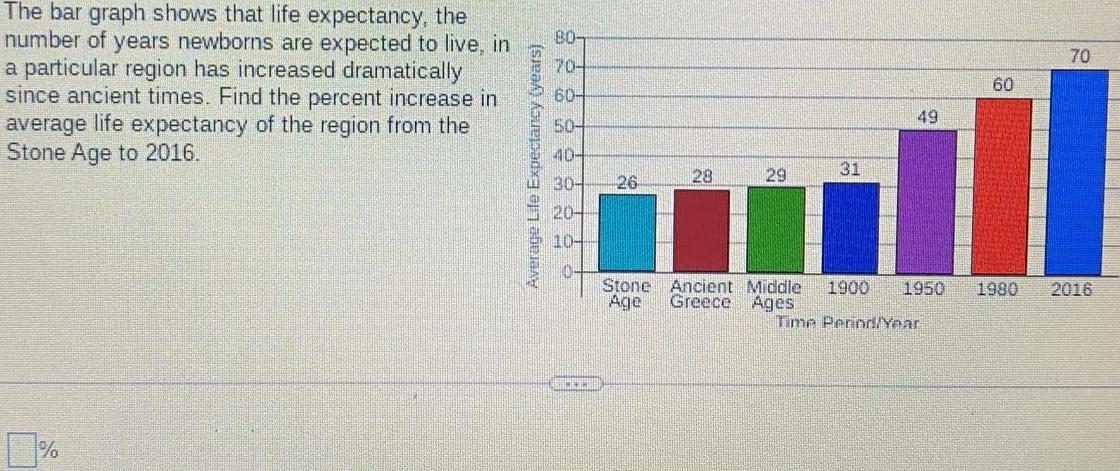
% The bar graph shows that life expectancy, the number of years newborns are expected to live, in a particular region has increased dramatically since ancient times. Find the percent increase in average life expectancy of the region from the Stone Age to 2016. Average Life Expectancy (years) 80- 70- 60- 70 60 49 50- 40- 30- 26 28 29 31 20- 10- Stone Ancient Middle Age Greece Ages 1900 1950 1980 2016 Time Period/Year
Step by Step Solution
There are 3 Steps involved in it
1 Expert Approved Answer
Step: 1 Unlock

Question Has Been Solved by an Expert!
Get step-by-step solutions from verified subject matter experts
Step: 2 Unlock
Step: 3 Unlock