

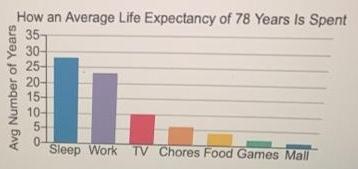
The bar graph shows the average number of years a group of people devoted to their most
Fantastic news! We've Found the answer you've been seeking!
Question:
The bar graph shows the average number of years a group of people devoted to their most time-consuming activities. According to the graph, a person from this group will devote 29 years to working and doing chores. The number of years working will exceed the number of years doing chores by 19. Over a life-time, how many years will be spent on each of these activities?
Expert Answer:

Related Book For 

Posted Date:
