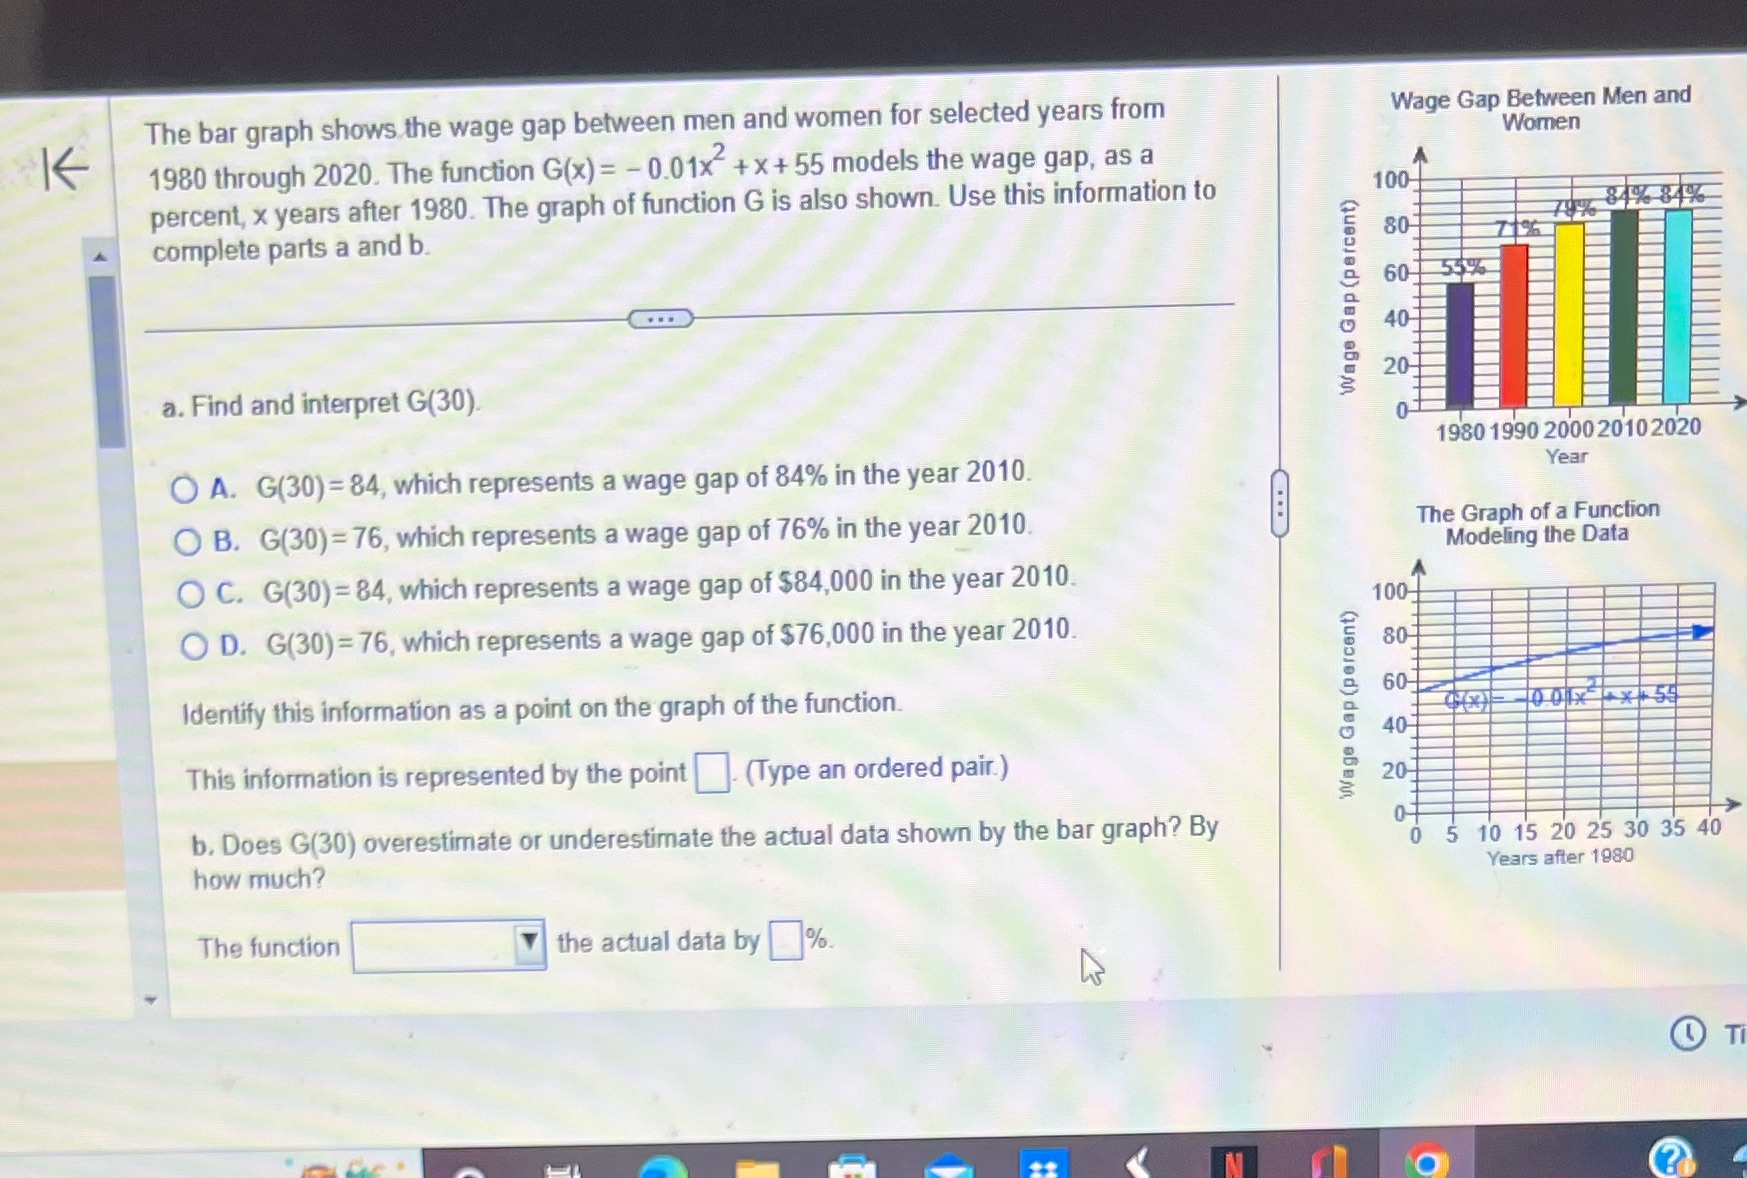
Question: The bar graph shows the wage gap between men and women for selected years from Wage Gap Between Men and K Women 1980 through 2020.

The bar graph shows the wage gap between men and
The bar graph shows the wage gap between men and women for selected years from Wage Gap Between Men and K Women 1980 through 2020. The function G(x) = - 0.01x-+ x +55 models the wage gap, as a percent, x years after 1980. The graph of function G is also shown. Use this information to 100- 84 849 complete parts a and b. 80 60 . . . Wage Gap (percent) 40 N a. Find and interpret G(30). 1980 1990 2000 2010 2020 O A. G(30) = 84, which represents a wage gap of 84% in the year 2010. Year O B. G(30) = 76, which represents a wage gap of 76% in the year 2010. The Graph of a Function Modeling the Data O C. G(30) = 84, which represents a wage gap of $84,000 in the year 2010. 100 O D. G(30) =76, which represents a wage gap of $76,000 in the year 2010. 80 Identify this information as a point on the graph of the function. $09 Wage Gap (percent) 4 0 0x X5 40 This information is represented by the point . (Type an ordered pair.) 20 b, Does G(30) overestimate or underestimate the actual data shown by the bar graph? By O- 5 10 15 20 25 30 35 40 how much? Years after 1980 The function the actual data by% Ti

Step by Step Solution

There are 3 Steps involved in it

1 Expert Approved Answer
Step: 1 Unlock blur-text-image
Question Has Been Solved by an Expert!

Get step-by-step solutions from verified subject matter experts

Step: 2 Unlock
Step: 3 Unlock

Students Have Also Explored These Related Mathematics Questions!