

Question: The below are Ratios and Graphs for AMG Global for the 4 year period to be given for the assignment. Kindly assist with the
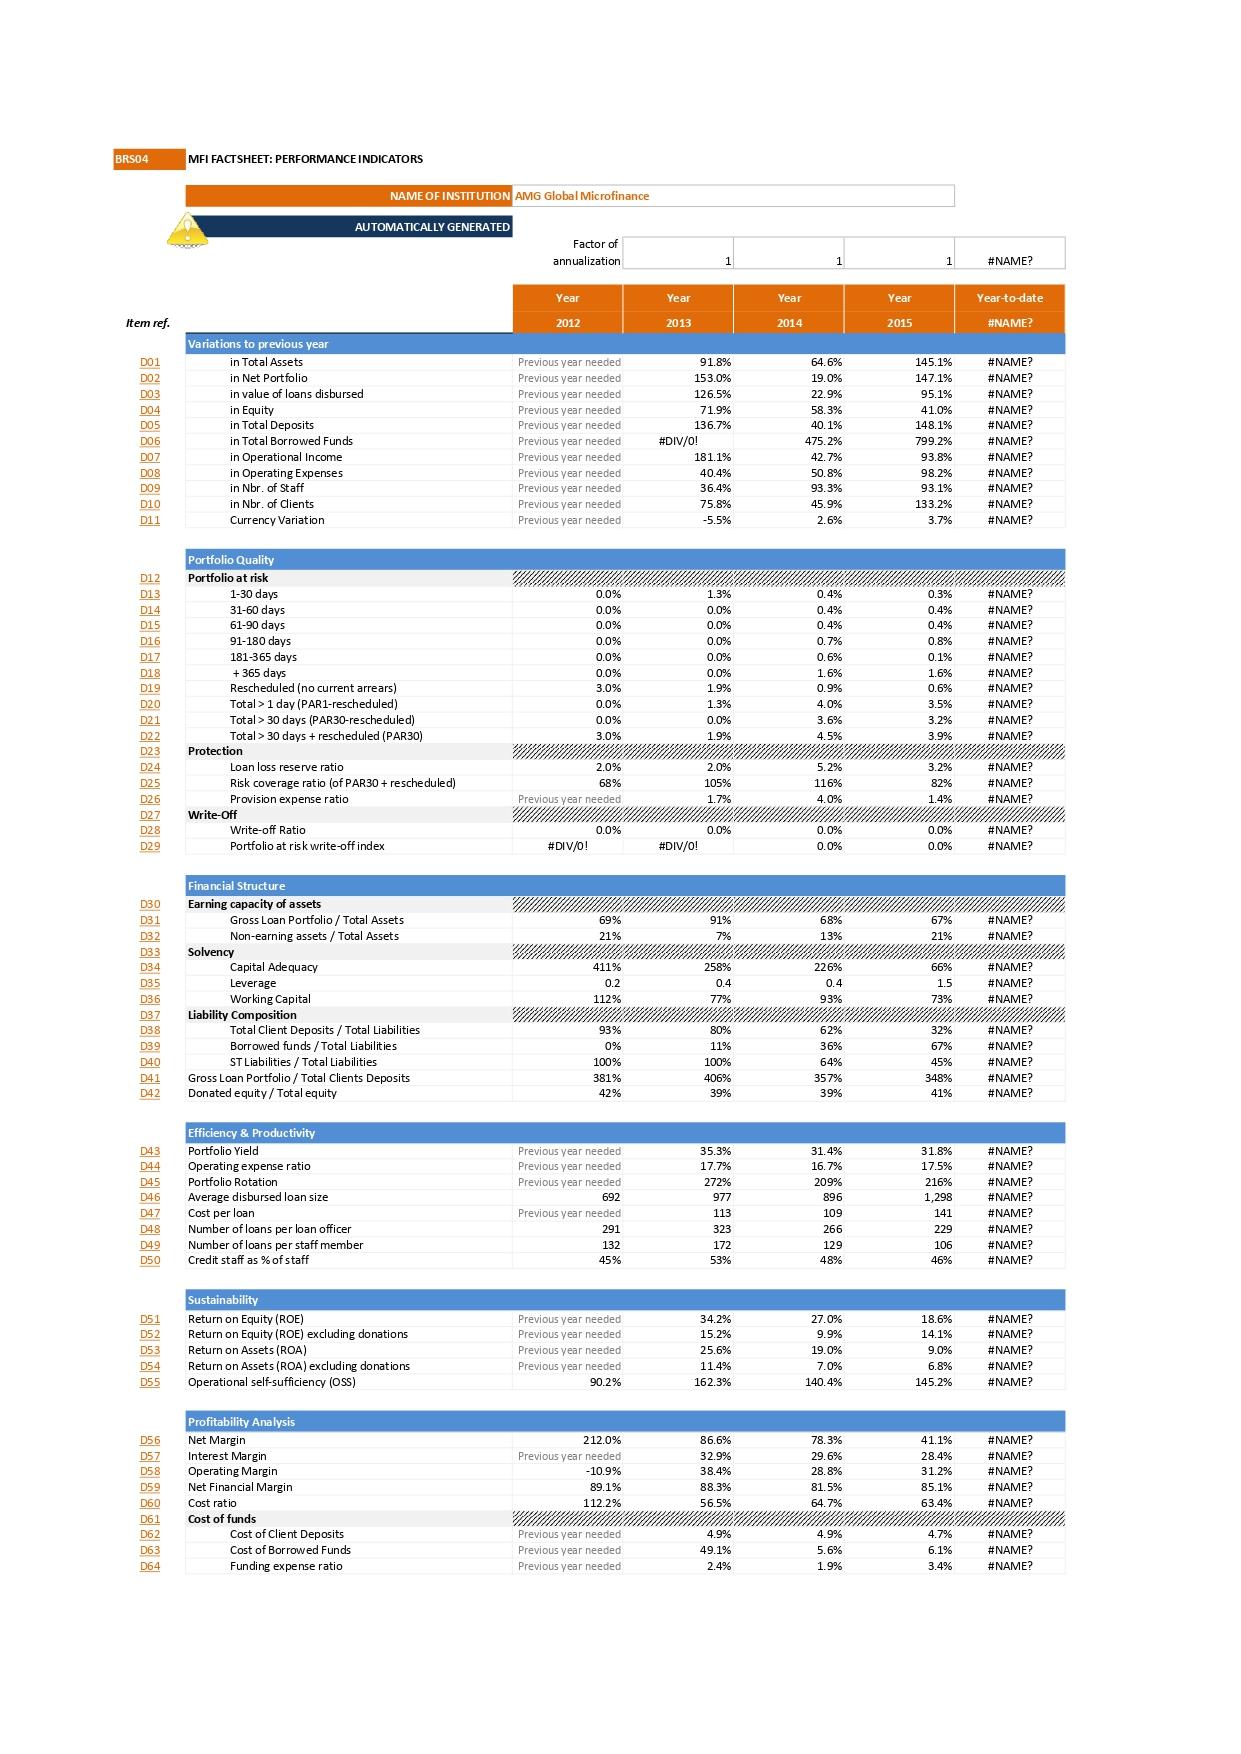
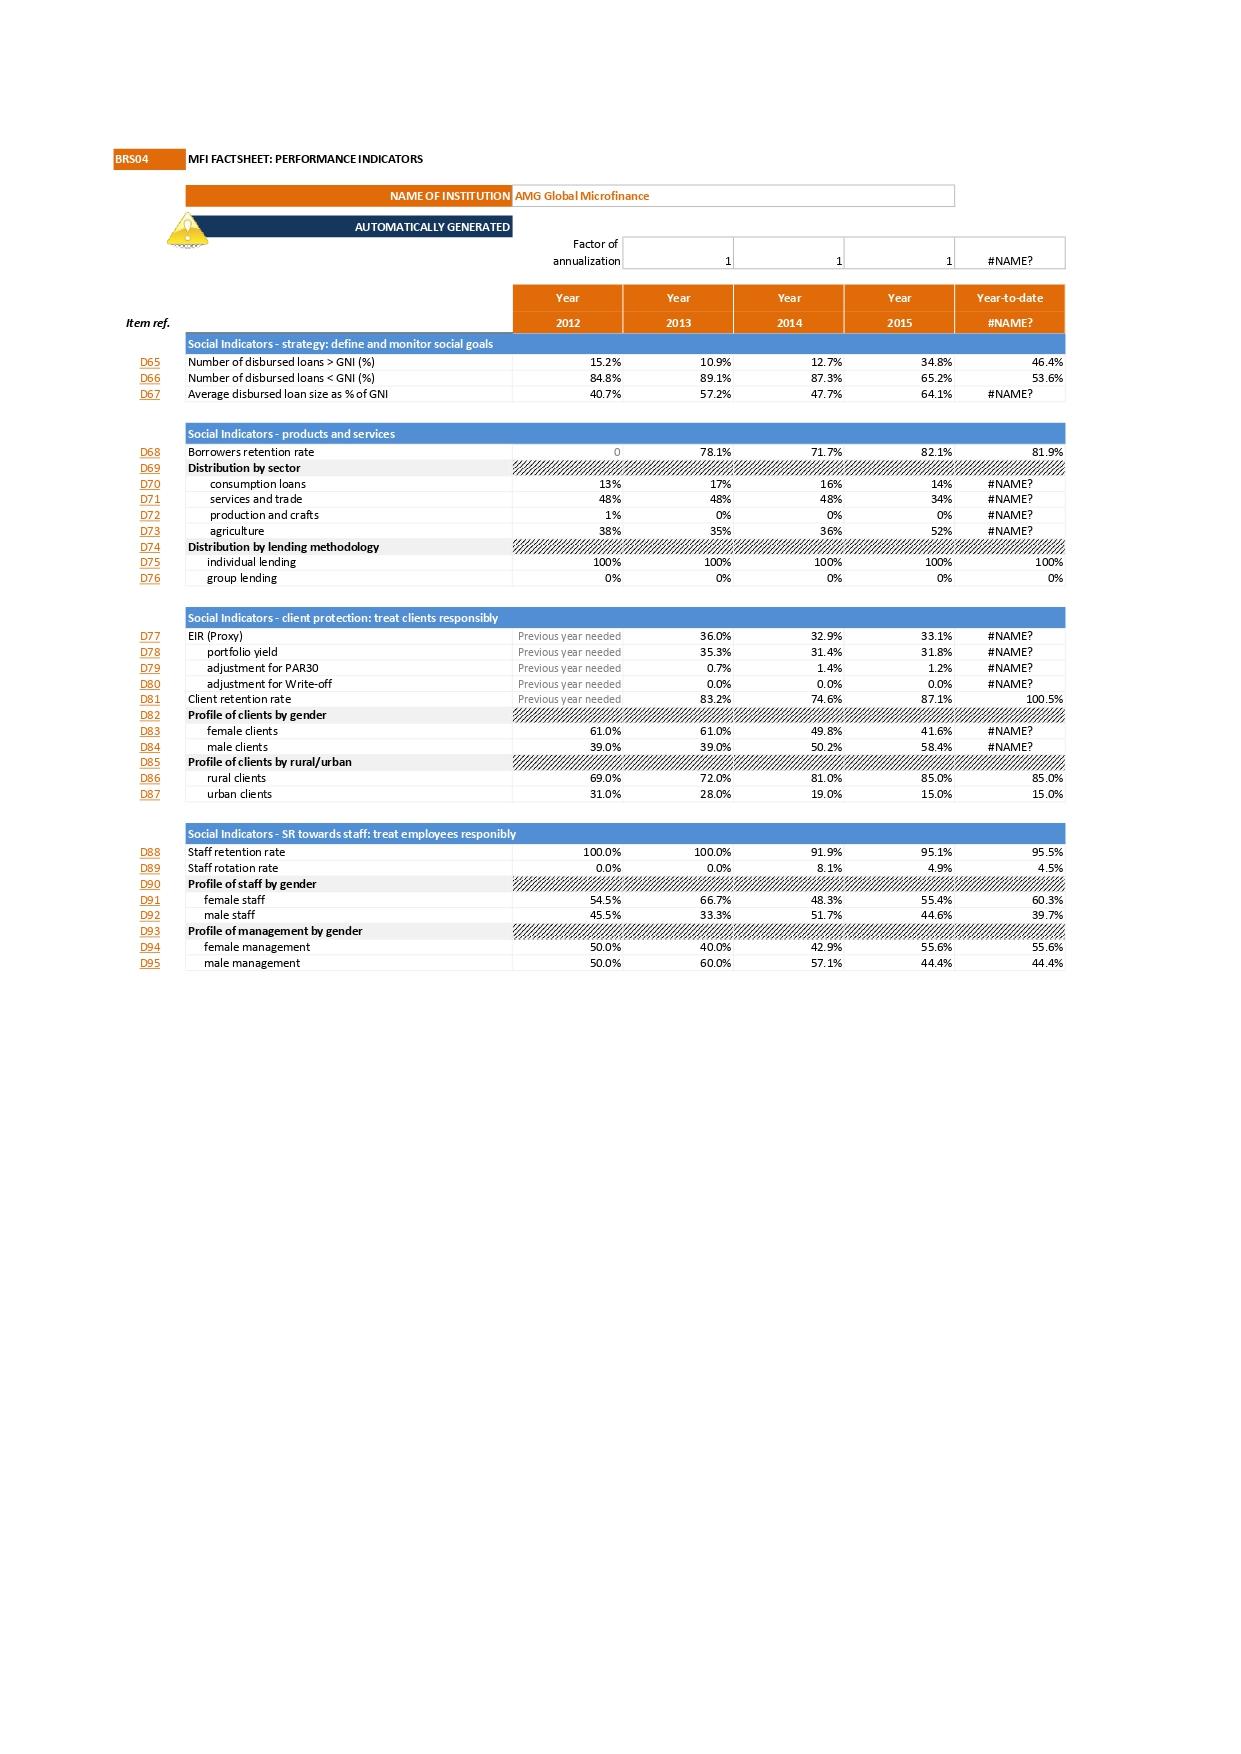
The below are Ratios and Graphs for AMG Global for the 4 year period to be given for the assignment.
Kindly assist with the question below
You are the recently appointed Financial Accountant for AMG Global Microfinance , which has been operational for the past 4 years yet without an analysis of its financial performance. Now things have changed. Its now a requirement by the regulators of microfinance institutions to have a well structured board that is expected to meet regularly to assess Financial Performance of the microfinance institution. Your Managing director request you to do a financial Analysis report covering the 4 year period, indicating areas of strengths, weaknesses and practical strategies to improve the organization.
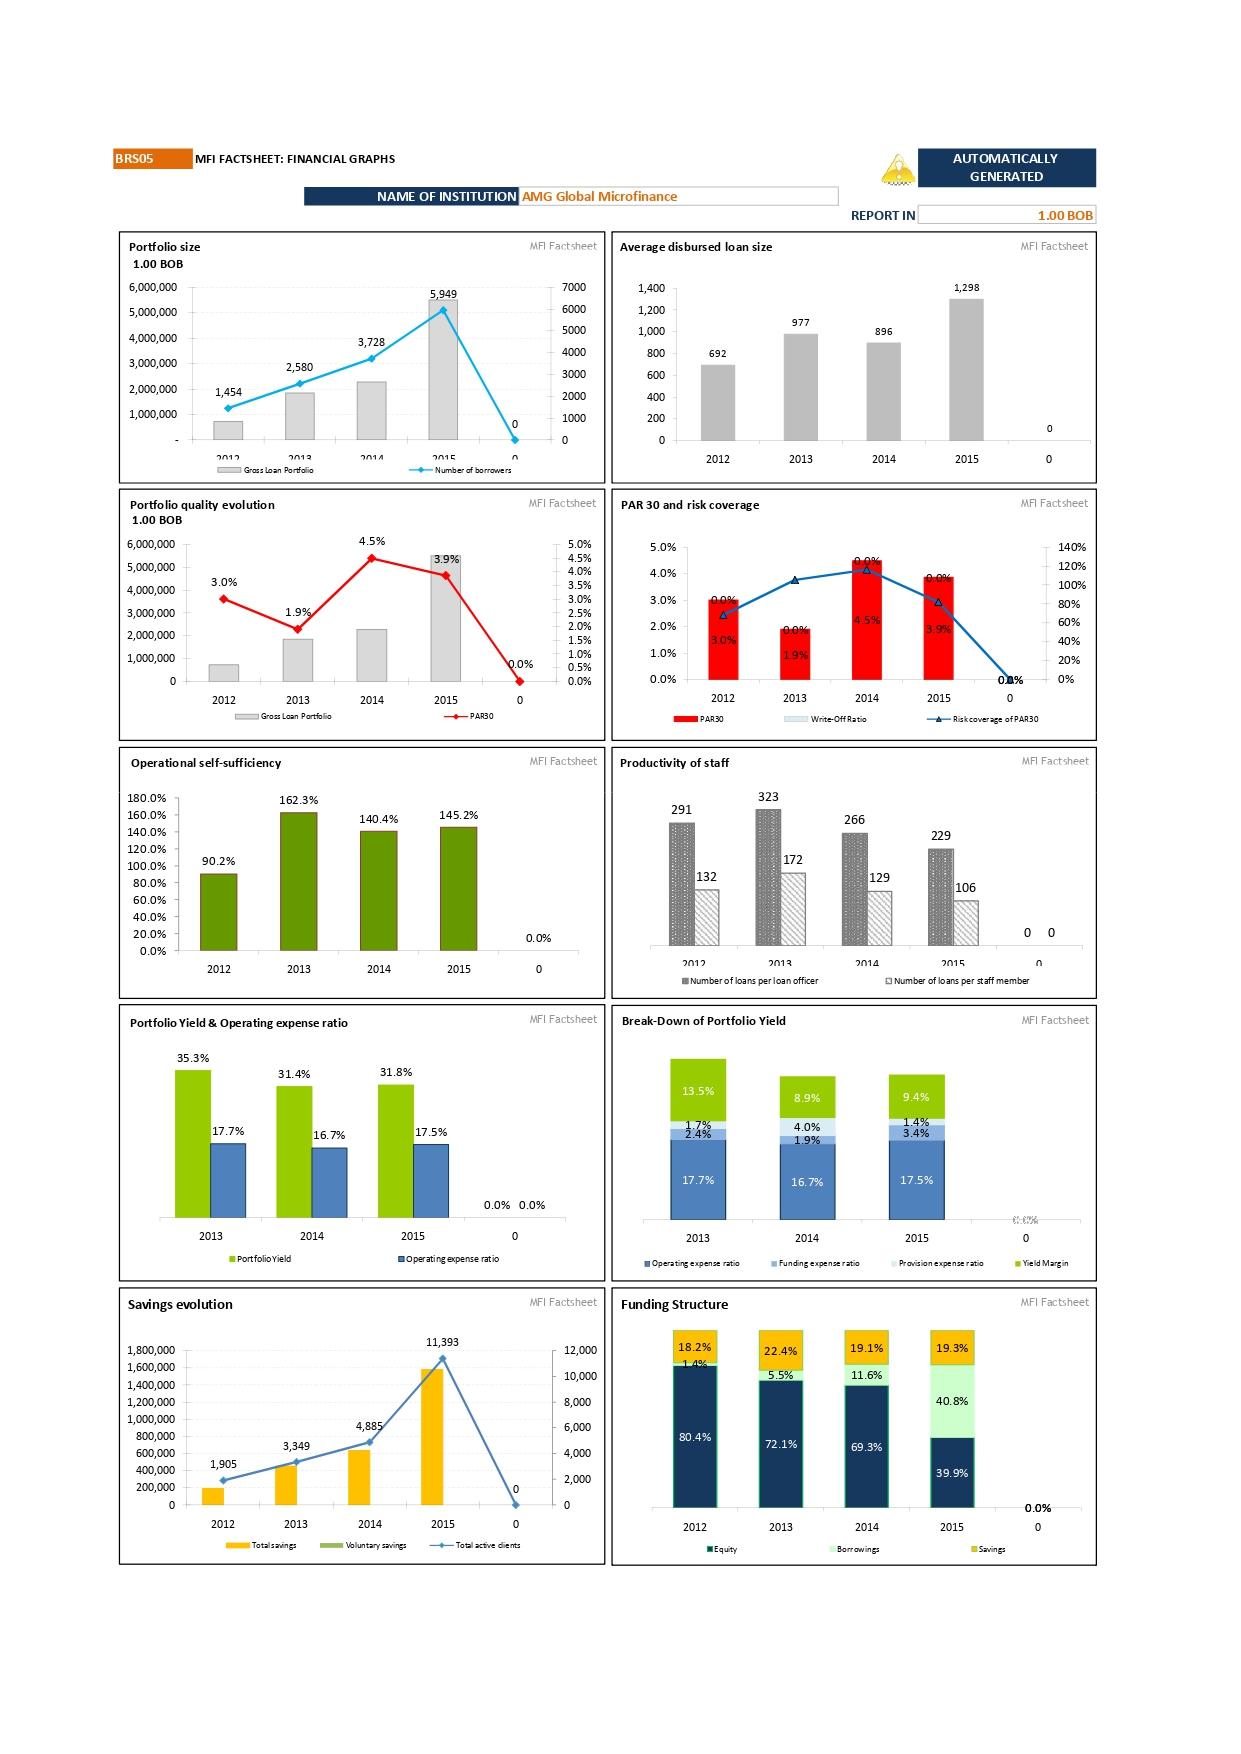
BRS05 Portfolio size 1.00 BOB 6,000,000 5,000,000 4,000,000 3,000,000 2,000,000 1,000,000 6,000,000 5,000,000 4,000,000 3,000,000 2,000,000 1,000,000 0 180.0% 160.0% 140.0% 120.0% 100.0% 80.0% 60.0% 40.0% 20.0% 0.0% Portfolio quality evolution 1.00 BOB MFI FACTSHEET: FINANCIAL GRAPHS 1,800,000 1,600,000 1,454 1,400,000 1,200,000 1,000,000 2012 800,000 600,000 400,000 200,000 0 Operational self-sufficiency 3.0% 2012 35.3% 90.2% 2012 Savings evolution 17.7% 2013 2012 Grass Loan Portfolio Portfolio Yield & Operating expense ratio 2,580 4.5% 3.9% 1.9% YN 2014 2015 1,905 2012 2013 Gross Loan Portfolio 162.3% 2013 I 31.4% Portfolio Yield 3,349 2014 2013 Totalsavings NAME OF INSTITUTION AMG Global Microfinance 16.7% 3,728 140.4% 2014 5,949 31.8% 4,885 2015 -Number of borrowers -PAR30 145.2% 2015 17.5% 0 n 2015 Operating expense ratio 11,393 MFI Factsheet 0.0% 0 2014 2015 0 Voluntary savings -Total active dients MFI Factsheet 7000 6000 5000 4000 3000 2000 1000 0.0% 0.0% 0.0% 0 0 5.0% 4.5% 4.0% MFI Factsheet 3.5% 3.0% 2.5% 2.0% 1.5% 1.0% 0.5% 0.0% MFI Factsheet MFI Factsheet 12,000 10,000 8,000 6,000 4,000 2,000 0 Average disbursed loan size 1,400 1,200 1,000 800 600 400 200 5.0% PAR 30 and risk coverage 4.0% 3.0% 2.0% 1.0% 0.0% 692 2012 291 0.0% 3.0% 2012 PAR30 Productivity of staff 132 13.5% 1.4% Break-Down of Portfolio Yield 17.7% 2013 2013 2012 Number of loans per loan officer Operating expense ratio 2012 Funding Structure 18.2% 1.4% 80.4% 323 977 Equity 2013 2013 172 8.9% 4.0% 1.9% 16.7% 2013 2014 Write-Off Ratio 2014 22.4% 5.5% 72.1% REPORT IN Funding expense ratio 266 896 2014 129 2014 www 19.1% 11.6 % 69.3% 2014 Borrowings 2015 9.4% 1.4% 3.4% 229 AUTOMATICALLY GENERATED 17.5% 2015 1,298 2015 106 2015 Number of loans per staff member 0.0% 0 Risk coverage of PAR30 Provision expense ratio 19.3% 40.8% 39.9% 2015 MFI Factsheet Savings 1.00 BOB MFI Factsheet 0 0 MFI Factsheet 0 0 0 n 140% 120% 100% 80% 60% 40% 20% 0% MFI Factsheet Yield Margin MFI Factsheet 0.0% 0
Step by Step Solution
3.28 Rating (145 Votes )
There are 3 Steps involved in it
Title Financial Analysis Report of AMG Global Microfinance 1 Introduction AMG Global Microfinance has been operational for the past four years providing financial services to underserved individuals a... View full answer

Get step-by-step solutions from verified subject matter experts