

Question: The below information was provided for an answer to a question about a 10 year forecast for supply and demand on electric vehicles in Australia.
The below information was provided for an answer to a question about a 10 year forecast for supply and demand on electric vehicles in Australia. The model for Tesla 3 was used for the graphic illustration to help with data. Feedback is that the illustration doesn't match the written paragraph and it doesn't clearly mention the final impact on P & Q. Can you please explain how this doesn't match, what it should state to match and how it can be clearer in the mention of the final impact on P&Q?
Supply and demand forecasts indicate that the EV market in Australia will experience growth over the next ten years. As a result, the net overall position for EVs will be positive. As the demand for EVs increases, there will be an increase in the supply of EVs, leading to economies of scale and lower production costs (Gans et al., 2017). However, there are potential barriers to increasing supply, such as the availability of necessary materials for EV batteries and production capacity constraints.
If the demand for EVs continues to increase as consumers become more aware of the benefits of EVs, the demand curve for EVs will shift to the right. This shift will result in a higher equilibrium quantity and price for EVs. On the supply side, as the demand for EVs increases, more manufacturers will enter the market, and existing manufacturers will expand their production capacity. Again, this will shift the supply curve to the right, with a higher equilibrium quantity and potentially a lower price. However, there are other factors to consider, such as the cost of battery production, government incentives and regulations, and the availability of renewable energy and charging infrastructure, which can affect both the demand and supply of EVs.
Overall, according to the analysis of the non-price determinants of supply and demand, the market quantity for EVs in Australia in ten years will continue growing as consumers become more aware of the benefits of EVs and as government policies and regulations continue to support their adoption. Anticipatedly, if the same consumer behaviour continues, the demand will continue to outweigh the supply. Figure 5 illustrates the shift in demand and supply for the Tesla Model 3 between 2023 and 2033.
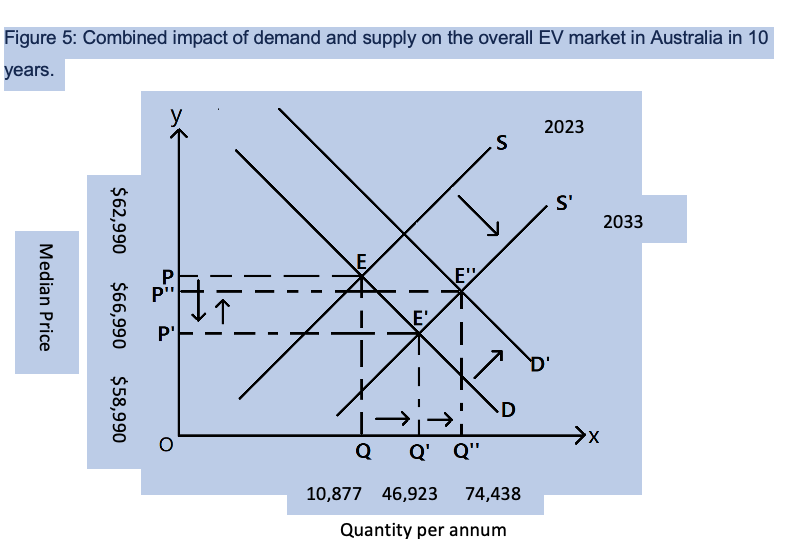
Figure 5: Combined impact of demand and supply on the overall EV market in Australia in 10 years. 2023 S S' 2033 E" Median Price 066'85$ 066'99$ 066'79$ P' D O Q >X Q' Q" 10,877 46,923 74,438 Quantity per annum
Step by Step Solution
There are 3 Steps involved in it

Get step-by-step solutions from verified subject matter experts