

Question: The below release provides information about EBITDA and adjusted EBITDA. It further states that these are non-GAAP measures. Help me understand what each of these
The below release provides information about EBITDA and adjusted EBITDA. It further states that these are non-GAAP measures. Help me understand what each of these terms (EBITDA, adjusted EBITDA and non-GAAP) mean, and put it in context by first explaining what GAAP is.
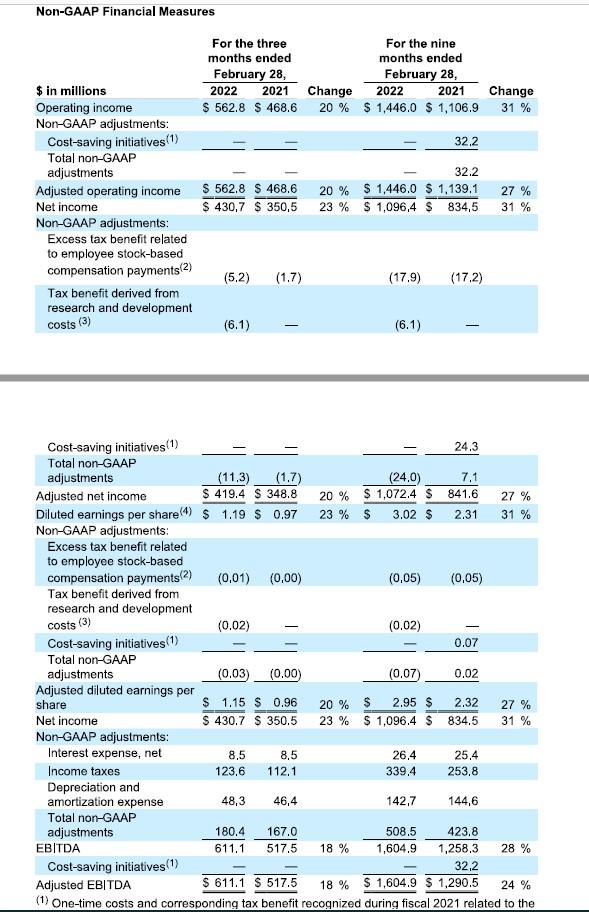
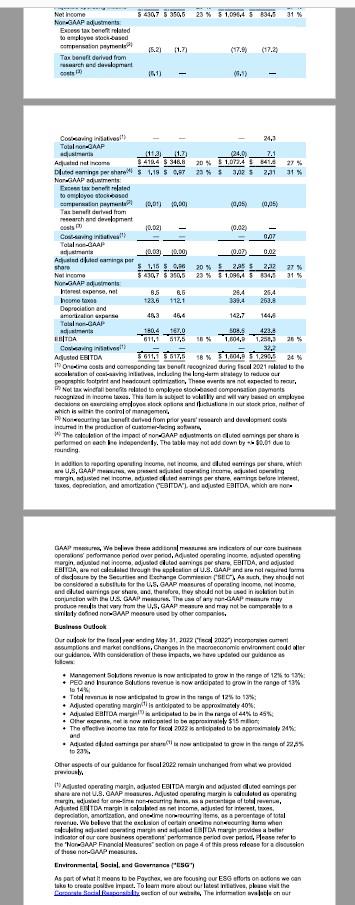
Non-GAAP Financial Measures $ in millions Operating income Non-GAAP adjustments: Cost-saving initiatives (1) Total non-GAAP adjustments Adjusted operating income Net income Non-GAAP adjustments: Excess tax benefit related to employee stock-based compensation payments(2) Tax benefit derived from research and development costs (3) Cost-saving initiatives (1) Total non-GAAP For the three months ended February 28, 2022 2021 $ 562.8 $ 468.6 Non-GAAP adjustments: Excess tax benefit related to employee stock-based compensation payments(2) Tax benefit derived from research and development costs (3) Cost-saving initiatives (1) Total non-GAAP adjustments Adjusted diluted earnings per share Net income (5.2) (6.1) 32.2 $ 562.8 $ 468.6 20% $1,446.0 $ 1,139.1 $430,7 $350,5 23% $1,096,4 $ 834,5 adjustments Adjusted net income Diluted earnings per share (4) $ 1.19 $ 0.97 (11.3) (1.7) $ 419.4 348.8 (1.7) (0,01) (0,00) (0.02) (0.03) (0.00) $ 1.15 S 0.96 $ 430.7 $ 350.5 8,5 8,5 123,6 112.1 48,3 180,4 611.1 Change 20% 46,4 20 % 23 % 20 % 23 % For the nine months ended February 28, 2022 2021 $1,446.0 $ 1,106.9 167.0 517.5 18 % $ (17.9) (6.1) (0,05) (24.0) 7,1 $ 1,072.4 $ 841.6 $ 3.02 $ 2.31 (0.02) (0.07) 2.95 $ $1,096.4 $ 26,4 339.4 32,2 142,7 508.5 1,604.9 (17.2) - 24.3 Non-GAAP adjustments: Interest expense, net Income taxes Depreciation and amortization expense Total non-GAAP adjustments EBITDA Cost-saving initiatives (1) Adjusted EBITDA $ 611.1 517.5 18 % $ 1,604.9 $1,290.5 24 % (1) One-time costs and corresponding tax benefit recognized during fiscal 2021 related to the (0.05) 0.07 0.02 2.32 834.5 25,4 253,8 Change 31% 144,6 27% 31% 27% 31% 27% 31% 423.8 1,258,3 28 % 32,2 Net Income Non-GAAP adjustments Excess tax benefit related to employee stock-based compensation paym Tax benefit derived from research and development 1) Cosaving insatives) Total GAAP adjustment Adjusted net income Diredeamings per share Non GAAP adjustments Excentax bene related to employ stockeased comparation paym Tax benefit derived from research and development costs Cost-saving native Telalo-GAAP atments $ 4307 5 3506 23 % 1,096.4 834.5 31 % Adjusted due aming par share Net Income Non GAAP adjustments Interest expense, net home tax Depreciation and amornication sparsa Tailo-GAAP adm EBITDA (52) (1.7) (1) (113) (1.7) 34194 $ 348.8 $ 1.19 $ 0.87 (0,01) (0,001 (0.02) (0.03) 10.00) $1.15$ 0,96 $410,70 $ 350.5 20 % 23% (17.9 (17.2) (24.0) 20% $1,0724 23 % 6.5 8.5 1236 112.1 483 464 1804 167.0 611,1 517,5 16 % (5.3) 3,02 1 (0,05) (0.02) 24,3 7.1 26.4 339.4 142.7 508.5 1,004,9 8416 2,31 (0,005) 0.07 0.02 (0.07) 2,95 s 2,312 1.0964 58345 25.4 263.8 144,6 423.8 1,258,3 27 % 31 % 27 % 31 % 26 % Coving inves") 32,2 Adjusted EBITDA $611,1 $5175 18 % 1004,9 1,290,5 24 % 19 One-time costs and comesponding tax beneft recognized during fiscal 2021 related to the coration of cosaving intatives, including the long-term strategy to reduce our peographic footprint and headcount optimization. These events are not expected to recur Not tax windfall benefits related to employee stockbased compensation payments recognized in income tous. This item is subject to volaly and will vary based on amplysa decisions on exercising employee stock options and fictuations in our stock prios, neither of which is within the control of management. Non recurring tax beneft derived from prior years' research and development costs incurred in the production of customer-facing awar The calculation of the impact of non-GAAP adjustments on lured eemings per share is performed on each he independenly. The table may not add down by $0.01 due to rounding In addition to reporting operating income, net income, and cluted semings per share, which are U,S, GAAP measures, we present scusated operating income, adjusted operating margin adjusted income, adjusted cluted earings per share, eaminge belare intere taxes depreciation, and amortization (EBITDA), and adjusted EBITDA, which are no GAAP mesure, We believe the addonsl mess are indicators of our core business operacions performance period over period, Adjusted operating income, adjusted operating margin, adjusted net income, adjusted cuted eamings per share, EBITDA, and adjusted EBITDA, are not cleadaled through the application of U.S. GAAP and are not required forma ofddosure by the Securities and Exchange Commission (SEC, As such, they should not be considered a substitute for the US. GAAP measures of operating income, net income and cuted earings per share, and, therefore, they should not be used in isolation but in conjunction with the US GAAP mesures. The use of any non-GAAP measurem producerets that vary from the US, GAAP measure and may not be comparable to a similarly defined non-GAAP messure used by other companies. Business Outlook Our outlook for the fiscal year ending May 31, 2022 (fiscal 2022") incorporates current assumptions and market conditions, Changes in the macroeconomic environment could alter our guidance. With consideration of these impacts, we have updated our guidance as Management Solutions revenue is now anticipated to grow in the range of 12% to 13% + PEO and Insurance Solutions revenue is now andoipated to grow in the range of 13% to 14% Total revenus now anticipated to grow in the range of 12% to 13%; Adjusted operating marginitis anticipated to be approximately 40%; Aduated EBITDA marginis articipated to be in the age of 44% to 45% *Other excente, net is now sicpated to be approsimily $15 mi The effective income tax rate for fiscal 2022 is anticipated to be approximately 24% and Aquated duted amings per share se now anticipated to grow in the range of 22,5% to 23% Other aspects of our guidance for fiscal 2022 remain unchanged from what we provided previously Adjusted operating margin, adjusted EBITDA margin and adjusted duted earnings per share are not U.S. CAAP measures. Adjusted operating margin is calculated as operating magined for one-time non-recurring fems, as a percentage of total revenue, Adjusted EBITDA margin is calculated as net income, adjusted for interest, tres, depreciation, amortization, and one time non recurring items, as a percentage of total revenue. We believe that the exclusion of certain onedime non ecuring Jame when calculating justed operating margin and adjusted EBITDA margin provides a better indicator of our core business operations performance period over period, Please refer to the "Non GAAP Financial Measures" section on page 4 of this press release for a discussion of these non-AP measures. Environmental Social, and Governance ("ESG") As part of what it means to be Payches, we are focusing our ESG efforts on actions we can lake to create pooltive impact. To leam more about our latest tatives, please visit the Commate Social Responsing section of our website, The information available on our Non-GAAP Financial Measures $ in millions Operating income Non-GAAP adjustments: Cost-saving initiatives (1) Total non-GAAP adjustments Adjusted operating income Net income Non-GAAP adjustments: Excess tax benefit related to employee stock-based compensation payments(2) Tax benefit derived from research and development costs (3) Cost-saving initiatives (1) Total non-GAAP For the three months ended February 28, 2022 2021 $ 562.8 $ 468.6 Non-GAAP adjustments: Excess tax benefit related to employee stock-based compensation payments(2) Tax benefit derived from research and development costs (3) Cost-saving initiatives (1) Total non-GAAP adjustments Adjusted diluted earnings per share Net income (5.2) (6.1) 32.2 $ 562.8 $ 468.6 20% $1,446.0 $ 1,139.1 $430,7 $350,5 23% $1,096,4 $ 834,5 adjustments Adjusted net income Diluted earnings per share (4) $ 1.19 $ 0.97 (11.3) (1.7) $ 419.4 348.8 (1.7) (0,01) (0,00) (0.02) (0.03) (0.00) $ 1.15 S 0.96 $ 430.7 $ 350.5 8,5 8,5 123,6 112.1 48,3 180,4 611.1 Change 20% 46,4 20 % 23 % 20 % 23 % For the nine months ended February 28, 2022 2021 $1,446.0 $ 1,106.9 167.0 517.5 18 % $ (17.9) (6.1) (0,05) (24.0) 7,1 $ 1,072.4 $ 841.6 $ 3.02 $ 2.31 (0.02) (0.07) 2.95 $ $1,096.4 $ 26,4 339.4 32,2 142,7 508.5 1,604.9 (17.2) - 24.3 Non-GAAP adjustments: Interest expense, net Income taxes Depreciation and amortization expense Total non-GAAP adjustments EBITDA Cost-saving initiatives (1) Adjusted EBITDA $ 611.1 517.5 18 % $ 1,604.9 $1,290.5 24 % (1) One-time costs and corresponding tax benefit recognized during fiscal 2021 related to the (0.05) 0.07 0.02 2.32 834.5 25,4 253,8 Change 31% 144,6 27% 31% 27% 31% 27% 31% 423.8 1,258,3 28 % 32,2 Net Income Non-GAAP adjustments Excess tax benefit related to employee stock-based compensation paym Tax benefit derived from research and development 1) Cosaving insatives) Total GAAP adjustment Adjusted net income Diredeamings per share Non GAAP adjustments Excentax bene related to employ stockeased comparation paym Tax benefit derived from research and development costs Cost-saving native Telalo-GAAP atments $ 4307 5 3506 23 % 1,096.4 834.5 31 % Adjusted due aming par share Net Income Non GAAP adjustments Interest expense, net home tax Depreciation and amornication sparsa Tailo-GAAP adm EBITDA (52) (1.7) (1) (113) (1.7) 34194 $ 348.8 $ 1.19 $ 0.87 (0,01) (0,001 (0.02) (0.03) 10.00) $1.15$ 0,96 $410,70 $ 350.5 20 % 23% (17.9 (17.2) (24.0) 20% $1,0724 23 % 6.5 8.5 1236 112.1 483 464 1804 167.0 611,1 517,5 16 % (5.3) 3,02 1 (0,05) (0.02) 24,3 7.1 26.4 339.4 142.7 508.5 1,004,9 8416 2,31 (0,005) 0.07 0.02 (0.07) 2,95 s 2,312 1.0964 58345 25.4 263.8 144,6 423.8 1,258,3 27 % 31 % 27 % 31 % 26 % Coving inves") 32,2 Adjusted EBITDA $611,1 $5175 18 % 1004,9 1,290,5 24 % 19 One-time costs and comesponding tax beneft recognized during fiscal 2021 related to the coration of cosaving intatives, including the long-term strategy to reduce our peographic footprint and headcount optimization. These events are not expected to recur Not tax windfall benefits related to employee stockbased compensation payments recognized in income tous. This item is subject to volaly and will vary based on amplysa decisions on exercising employee stock options and fictuations in our stock prios, neither of which is within the control of management. Non recurring tax beneft derived from prior years' research and development costs incurred in the production of customer-facing awar The calculation of the impact of non-GAAP adjustments on lured eemings per share is performed on each he independenly. The table may not add down by $0.01 due to rounding In addition to reporting operating income, net income, and cluted semings per share, which are U,S, GAAP measures, we present scusated operating income, adjusted operating margin adjusted income, adjusted cluted earings per share, eaminge belare intere taxes depreciation, and amortization (EBITDA), and adjusted EBITDA, which are no GAAP mesure, We believe the addonsl mess are indicators of our core business operacions performance period over period, Adjusted operating income, adjusted operating margin, adjusted net income, adjusted cuted eamings per share, EBITDA, and adjusted EBITDA, are not cleadaled through the application of U.S. GAAP and are not required forma ofddosure by the Securities and Exchange Commission (SEC, As such, they should not be considered a substitute for the US. GAAP measures of operating income, net income and cuted earings per share, and, therefore, they should not be used in isolation but in conjunction with the US GAAP mesures. The use of any non-GAAP measurem producerets that vary from the US, GAAP measure and may not be comparable to a similarly defined non-GAAP messure used by other companies. Business Outlook Our outlook for the fiscal year ending May 31, 2022 (fiscal 2022") incorporates current assumptions and market conditions, Changes in the macroeconomic environment could alter our guidance. With consideration of these impacts, we have updated our guidance as Management Solutions revenue is now anticipated to grow in the range of 12% to 13% + PEO and Insurance Solutions revenue is now andoipated to grow in the range of 13% to 14% Total revenus now anticipated to grow in the range of 12% to 13%; Adjusted operating marginitis anticipated to be approximately 40%; Aduated EBITDA marginis articipated to be in the age of 44% to 45% *Other excente, net is now sicpated to be approsimily $15 mi The effective income tax rate for fiscal 2022 is anticipated to be approximately 24% and Aquated duted amings per share se now anticipated to grow in the range of 22,5% to 23% Other aspects of our guidance for fiscal 2022 remain unchanged from what we provided previously Adjusted operating margin, adjusted EBITDA margin and adjusted duted earnings per share are not U.S. CAAP measures. Adjusted operating margin is calculated as operating magined for one-time non-recurring fems, as a percentage of total revenue, Adjusted EBITDA margin is calculated as net income, adjusted for interest, tres, depreciation, amortization, and one time non recurring items, as a percentage of total revenue. We believe that the exclusion of certain onedime non ecuring Jame when calculating justed operating margin and adjusted EBITDA margin provides a better indicator of our core business operations performance period over period, Please refer to the "Non GAAP Financial Measures" section on page 4 of this press release for a discussion of these non-AP measures. Environmental Social, and Governance ("ESG") As part of what it means to be Payches, we are focusing our ESG efforts on actions we can lake to create pooltive impact. To leam more about our latest tatives, please visit the Commate Social Responsing section of our website, The information available on our
Step by Step Solution
There are 3 Steps involved in it

Get step-by-step solutions from verified subject matter experts