

Question: The below table summarizes the 2017 income statement and end-year balance sheet of Drake's Bowling Alleys. Drake's financial manager forecasts a 15% increase in sales
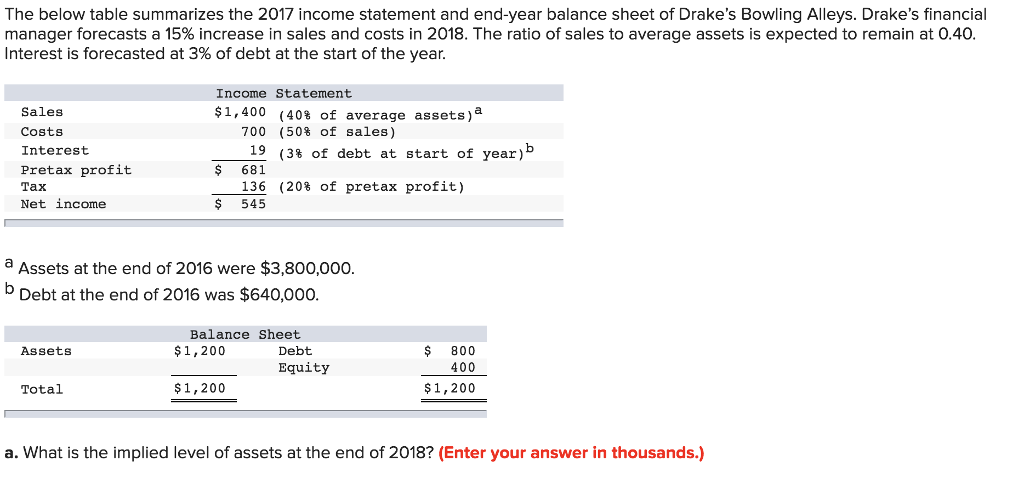
The below table summarizes the 2017 income statement and end-year balance sheet of Drake's Bowling Alleys. Drake's financial manager forecasts a 15% increase in sales and costs in 2018. The ratio of sales to average assets is expected to remain at 0.40 Interest is forecasted at 3% of debt at the start of the year. Income Statement $1,400 (40% of average assets) Sales Costs Interest Pretax profit Tax Net income 700 (50% of sales) 19 (3% of debt at start of year) $ 681 136 (20% of pretax profit) $ 545 a Assets at the end of 2016 were $3,800,000 Debt at the end of 2016 was $640,000 Balance Sheet $1,200 $ 800 400 Assets Debt Equity Total $1,200 $1,200 a. What is the implied level of assets at the end of 2018? (Enter your answer in thousands.)
Step by Step Solution
There are 3 Steps involved in it

Get step-by-step solutions from verified subject matter experts