Question: (The benchmark case) Use the simulation model to study the performance of ChemBlends current policy (accept any order, as long as it can be produced
-
(The benchmark case) Use the simulation model to study the performance of ChemBlends current policy (accept any order, as long as it can be produced during the 250-day calendar).
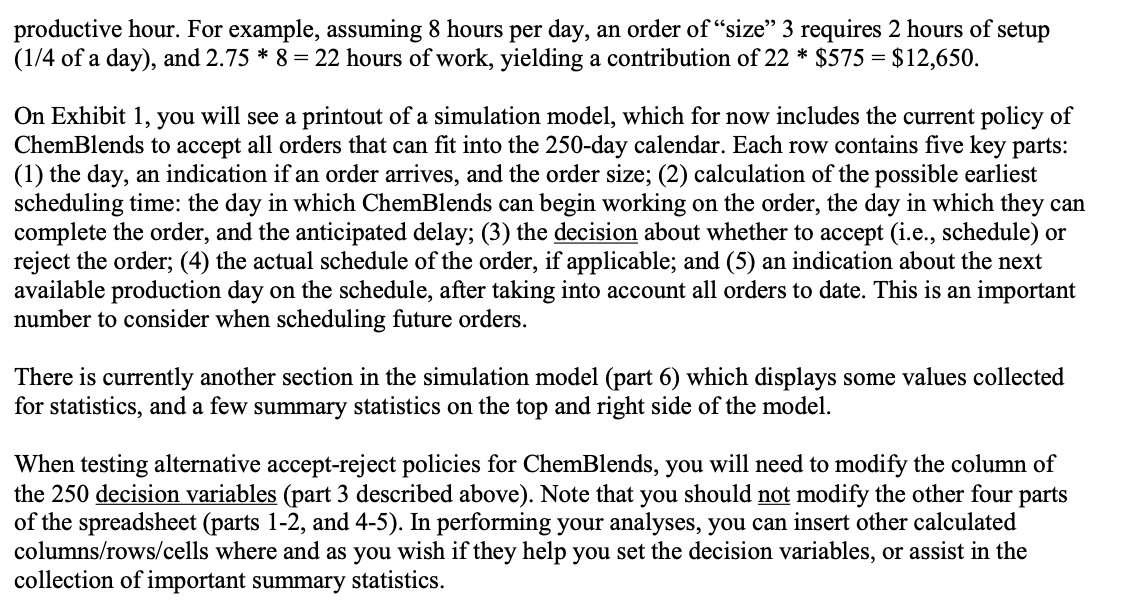
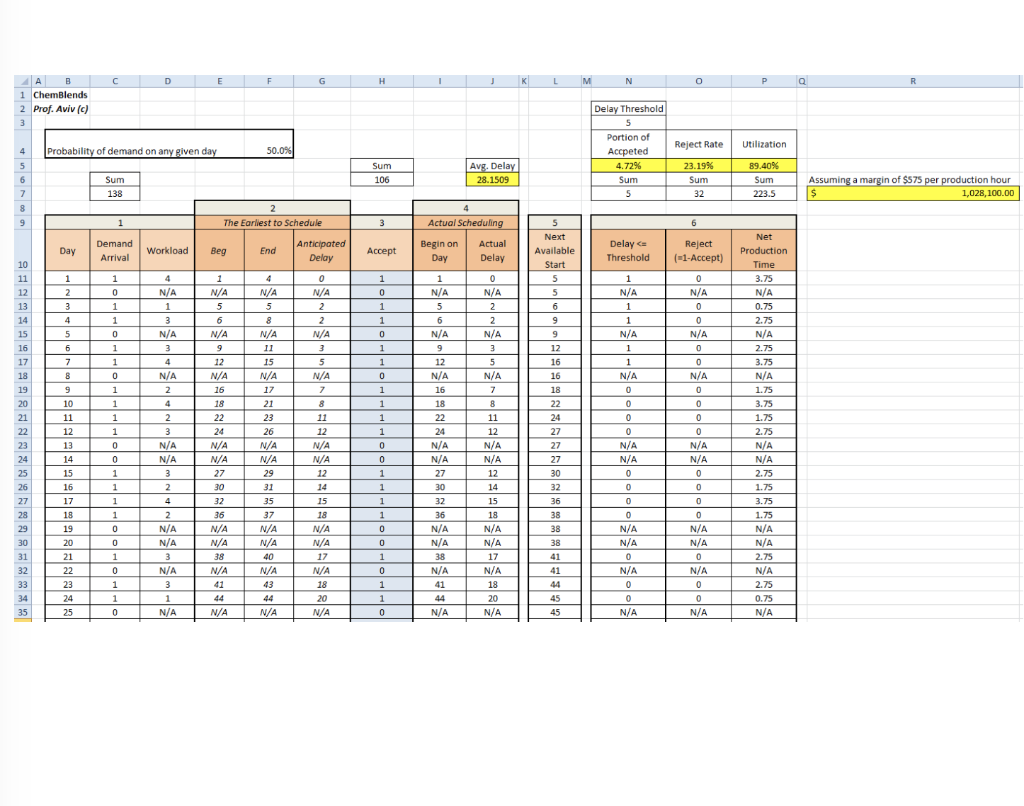
Background ChemBlends sells chemical blends to large business customers. A typical customer orders the blends in large quantities, but in a relatively sporadic and infrequent fashion. An order requires a significant setup time (of 1/4 of a work day), and orders from different customers vary in sizes, requiring a total production time of 1-to-4 days (setup included). ChemBlends maintains a policy of first-come-first-served when scheduling production. Thus, they will always schedule production for an accepted order at the earliest possible date. ChemBlends has a single production line, and can process only one order at a time. Delivery times are important, and ChemBlends often hears complaints from its customers about the long wait times they experience. Recent surveys suggest that customers tend to be highly satisfied if the delay in beginning the production of their orders is between 0-3 days, satisfied if it is between 4-6 days, somewhat dissatisfied if the delay falls between 7-10 days, and very dissatisfied if it exceeds 10 days. Recently, Jacob D., a production planner at ChemBlends recommended that the company reconsider the current policy of accepting all customer orders. Jacob's rationale was that in peak demand periods, the acceptance of too many orders can result in long delays, and consequently increase customer dissatisfaction. Nonetheless, Jacob was cognizant of the possibility that rejection of orders would upset the customers whose orders were declined; not to mention the forgone revenue. Additionally, Jacob anticipated that his idea would generate a negative response from his general production manager since production performance is measured on the basis of process utilization (process utilization is defined as the average portion of time that the production line is in active use; i.e., excluding setup and idle times). A Simulation Model To study the problem that ChemBlends faces, we will utilize a relatively simple simulation model, describing the arrival of customer orders over a course of 250 days. On each day, there is a chance of 50% that an order is received (at the beginning of the day); no more than a single order is placed on any given day. Order sizes in terms of total work time required) are statistically independent, and require 1, 2, 3, or 4 days, with equal probabilities of 25%. It is estimated that an order brings a contribution of $575 per productive hour. For example, assuming 8 hours per day, an order of size 3 requires 2 hours of setup (1/4 of a day), and 2.75 * 8 = 22 hours of work, yielding a contribution of 22 * $575 = $12,650. On Exhibit 1, you will see a printout of a simulation model, which for now includes the current policy of ChemBlends to accept all orders that can fit into the 250-day calendar. Each row contains five key parts: (1) the day, an indication if an order arrives, and the order size; (2) calculation of the possible earliest scheduling time: the day in which ChemBlends can begin working on the order, the day in which they can complete the order, and the anticipated delay; (3) the decision about whether to accept (i.e., schedule) or reject the order; (4) the actual schedule of the order, if applicable; and (5) an indication about the next available production day on the schedule, after taking into account all orders to date. This is an important number to consider when scheduling future orders. There is currently another section in the simulation model (part 6) which displays some values collected for statistics, and a few summary statistics on the top and right side of the model. When testing alternative accept-reject policies for ChemBlends, you will need to modify the column of the 250 decision variables (part 3 described above). Note that you should not modify the other four parts of the spreadsheet (parts 1-2, and 4-5). In performing your analyses, you can insert other calculated columns/rows/cells where and as you wish if they help you set the decision variables, or assist in the collection of important summary statistics. D E F H 1 K L M N o P Q R B 1 ChemBlends 2 Prof. Aviv (c) 3 Utilization 4 Probability of demand on any given day Reject Rate 50.0% Delay Threshold 5 Portion of Accpeted 4.72% Sum 5 5 Sum 106 Avg. Delay 28.1509 89.40% Sum 6 7 8 23.1996 Sum 32 Sum 138 Assuming a margin of $575 per production hour $ 1,028,100.00 223.5 4 4 2 The Earliest to Schedule 9 1 3 Actual Scheduling 5 6 Day Demand Arrival Workload Beg End Anticipated Delay Accept Begin on Day Actual Delay Delay Threshold Reject (-1-Accept) 1 0 1 N/A 1 0 0 N/A 1 1 2 3 4 5 6 7 8 9 9 0 Next Available Start 5 5 5 6 9 9 4 N/A 1 3 N/A 3 5 6 N/A 9 12 N/A 1 0 1 0 N/A 2 2 N/A 3 5 N/A 7 0 N/A 2 2 N/A 3 1 1 0 0 1 1 0 0 1 4 N/A 5 8 N/A 11 15 N/A 17 21 23 26 N/A N/A 29 0 N/A 0 0 N/A 0 1 N/A 5 6 N/A 9 12 N/A 16 18 22 24 N/A N/A 27 30 1 N/A 1 1 N/A 1 1 N/A 0 0 0 0 0 N/A N/A 0 1 1 1 16 18 10 8 1 4 N/A 2 4 2 3 N/A N/A 3 2 0 0 1 1 10 11 12 13 14 15 16 17 18 19 20 21 22 23 24 25 26 27 28 29 30 31 32 33 34 35 11 12 1 1 0 0 0 0 0 0 N/A N/A 0 Net Production Time 3.75 N/A 0.75 2.75 N/A 2.75 3.75 N/A 1.75 3.75 1.75 2.75 N/A N/A 2.75 1.75 3.75 1.75 N/A N/A 2.75 N/A 2.75 0.75 N/A 1 1 22 24 N/A N/A 27 30 32 36 N/A N/A 38 N/A 1 1 1 12 16 16 18 22 24 27 27 27 30 32 36 38 38 38 41 41 44 45 45 5 N/A 7 8 11 12 N/A N/A 12 14 15 18 N/A N/A 17 N/A 18 20 N/A 0 11 12 13 14 15 16 17 18 19 20 21 22 23 24 25 0 0 1 0 35 37 N/A N/A 12 14 15 18 N/A N/A 17 N/A 18 20 N/A 4 2 N/A N/A 3 N/A 3 1 0 0 0 1 0 1 1 0 0 0 N/A N/A 40 N/A 43 1 32 36 N/A N/A 38 N/A 41 44 A N/A 0 N/A N/A 0 N/A 0 0 N/A 0 N/A N/A 0 N/A 0 0 0 N/A 0 1 0 1 N/A 44 N/A 1 1 0 N/A Background ChemBlends sells chemical blends to large business customers. A typical customer orders the blends in large quantities, but in a relatively sporadic and infrequent fashion. An order requires a significant setup time (of 1/4 of a work day), and orders from different customers vary in sizes, requiring a total production time of 1-to-4 days (setup included). ChemBlends maintains a policy of first-come-first-served when scheduling production. Thus, they will always schedule production for an accepted order at the earliest possible date. ChemBlends has a single production line, and can process only one order at a time. Delivery times are important, and ChemBlends often hears complaints from its customers about the long wait times they experience. Recent surveys suggest that customers tend to be highly satisfied if the delay in beginning the production of their orders is between 0-3 days, satisfied if it is between 4-6 days, somewhat dissatisfied if the delay falls between 7-10 days, and very dissatisfied if it exceeds 10 days. Recently, Jacob D., a production planner at ChemBlends recommended that the company reconsider the current policy of accepting all customer orders. Jacob's rationale was that in peak demand periods, the acceptance of too many orders can result in long delays, and consequently increase customer dissatisfaction. Nonetheless, Jacob was cognizant of the possibility that rejection of orders would upset the customers whose orders were declined; not to mention the forgone revenue. Additionally, Jacob anticipated that his idea would generate a negative response from his general production manager since production performance is measured on the basis of process utilization (process utilization is defined as the average portion of time that the production line is in active use; i.e., excluding setup and idle times). A Simulation Model To study the problem that ChemBlends faces, we will utilize a relatively simple simulation model, describing the arrival of customer orders over a course of 250 days. On each day, there is a chance of 50% that an order is received (at the beginning of the day); no more than a single order is placed on any given day. Order sizes in terms of total work time required) are statistically independent, and require 1, 2, 3, or 4 days, with equal probabilities of 25%. It is estimated that an order brings a contribution of $575 per productive hour. For example, assuming 8 hours per day, an order of size 3 requires 2 hours of setup (1/4 of a day), and 2.75 * 8 = 22 hours of work, yielding a contribution of 22 * $575 = $12,650. On Exhibit 1, you will see a printout of a simulation model, which for now includes the current policy of ChemBlends to accept all orders that can fit into the 250-day calendar. Each row contains five key parts: (1) the day, an indication if an order arrives, and the order size; (2) calculation of the possible earliest scheduling time: the day in which ChemBlends can begin working on the order, the day in which they can complete the order, and the anticipated delay; (3) the decision about whether to accept (i.e., schedule) or reject the order; (4) the actual schedule of the order, if applicable; and (5) an indication about the next available production day on the schedule, after taking into account all orders to date. This is an important number to consider when scheduling future orders. There is currently another section in the simulation model (part 6) which displays some values collected for statistics, and a few summary statistics on the top and right side of the model. When testing alternative accept-reject policies for ChemBlends, you will need to modify the column of the 250 decision variables (part 3 described above). Note that you should not modify the other four parts of the spreadsheet (parts 1-2, and 4-5). In performing your analyses, you can insert other calculated columns/rows/cells where and as you wish if they help you set the decision variables, or assist in the collection of important summary statistics. D E F H 1 K L M N o P Q R B 1 ChemBlends 2 Prof. Aviv (c) 3 Utilization 4 Probability of demand on any given day Reject Rate 50.0% Delay Threshold 5 Portion of Accpeted 4.72% Sum 5 5 Sum 106 Avg. Delay 28.1509 89.40% Sum 6 7 8 23.1996 Sum 32 Sum 138 Assuming a margin of $575 per production hour $ 1,028,100.00 223.5 4 4 2 The Earliest to Schedule 9 1 3 Actual Scheduling 5 6 Day Demand Arrival Workload Beg End Anticipated Delay Accept Begin on Day Actual Delay Delay Threshold Reject (-1-Accept) 1 0 1 N/A 1 0 0 N/A 1 1 2 3 4 5 6 7 8 9 9 0 Next Available Start 5 5 5 6 9 9 4 N/A 1 3 N/A 3 5 6 N/A 9 12 N/A 1 0 1 0 N/A 2 2 N/A 3 5 N/A 7 0 N/A 2 2 N/A 3 1 1 0 0 1 1 0 0 1 4 N/A 5 8 N/A 11 15 N/A 17 21 23 26 N/A N/A 29 0 N/A 0 0 N/A 0 1 N/A 5 6 N/A 9 12 N/A 16 18 22 24 N/A N/A 27 30 1 N/A 1 1 N/A 1 1 N/A 0 0 0 0 0 N/A N/A 0 1 1 1 16 18 10 8 1 4 N/A 2 4 2 3 N/A N/A 3 2 0 0 1 1 10 11 12 13 14 15 16 17 18 19 20 21 22 23 24 25 26 27 28 29 30 31 32 33 34 35 11 12 1 1 0 0 0 0 0 0 N/A N/A 0 Net Production Time 3.75 N/A 0.75 2.75 N/A 2.75 3.75 N/A 1.75 3.75 1.75 2.75 N/A N/A 2.75 1.75 3.75 1.75 N/A N/A 2.75 N/A 2.75 0.75 N/A 1 1 22 24 N/A N/A 27 30 32 36 N/A N/A 38 N/A 1 1 1 12 16 16 18 22 24 27 27 27 30 32 36 38 38 38 41 41 44 45 45 5 N/A 7 8 11 12 N/A N/A 12 14 15 18 N/A N/A 17 N/A 18 20 N/A 0 11 12 13 14 15 16 17 18 19 20 21 22 23 24 25 0 0 1 0 35 37 N/A N/A 12 14 15 18 N/A N/A 17 N/A 18 20 N/A 4 2 N/A N/A 3 N/A 3 1 0 0 0 1 0 1 1 0 0 0 N/A N/A 40 N/A 43 1 32 36 N/A N/A 38 N/A 41 44 A N/A 0 N/A N/A 0 N/A 0 0 N/A 0 N/A N/A 0 N/A 0 0 0 N/A 0 1 0 1 N/A 44 N/A 1 1 0 N/A


