

Question: The black curve in the graph below is given by y = 1 . 9 e - 0 . 8 1 x - 3 .
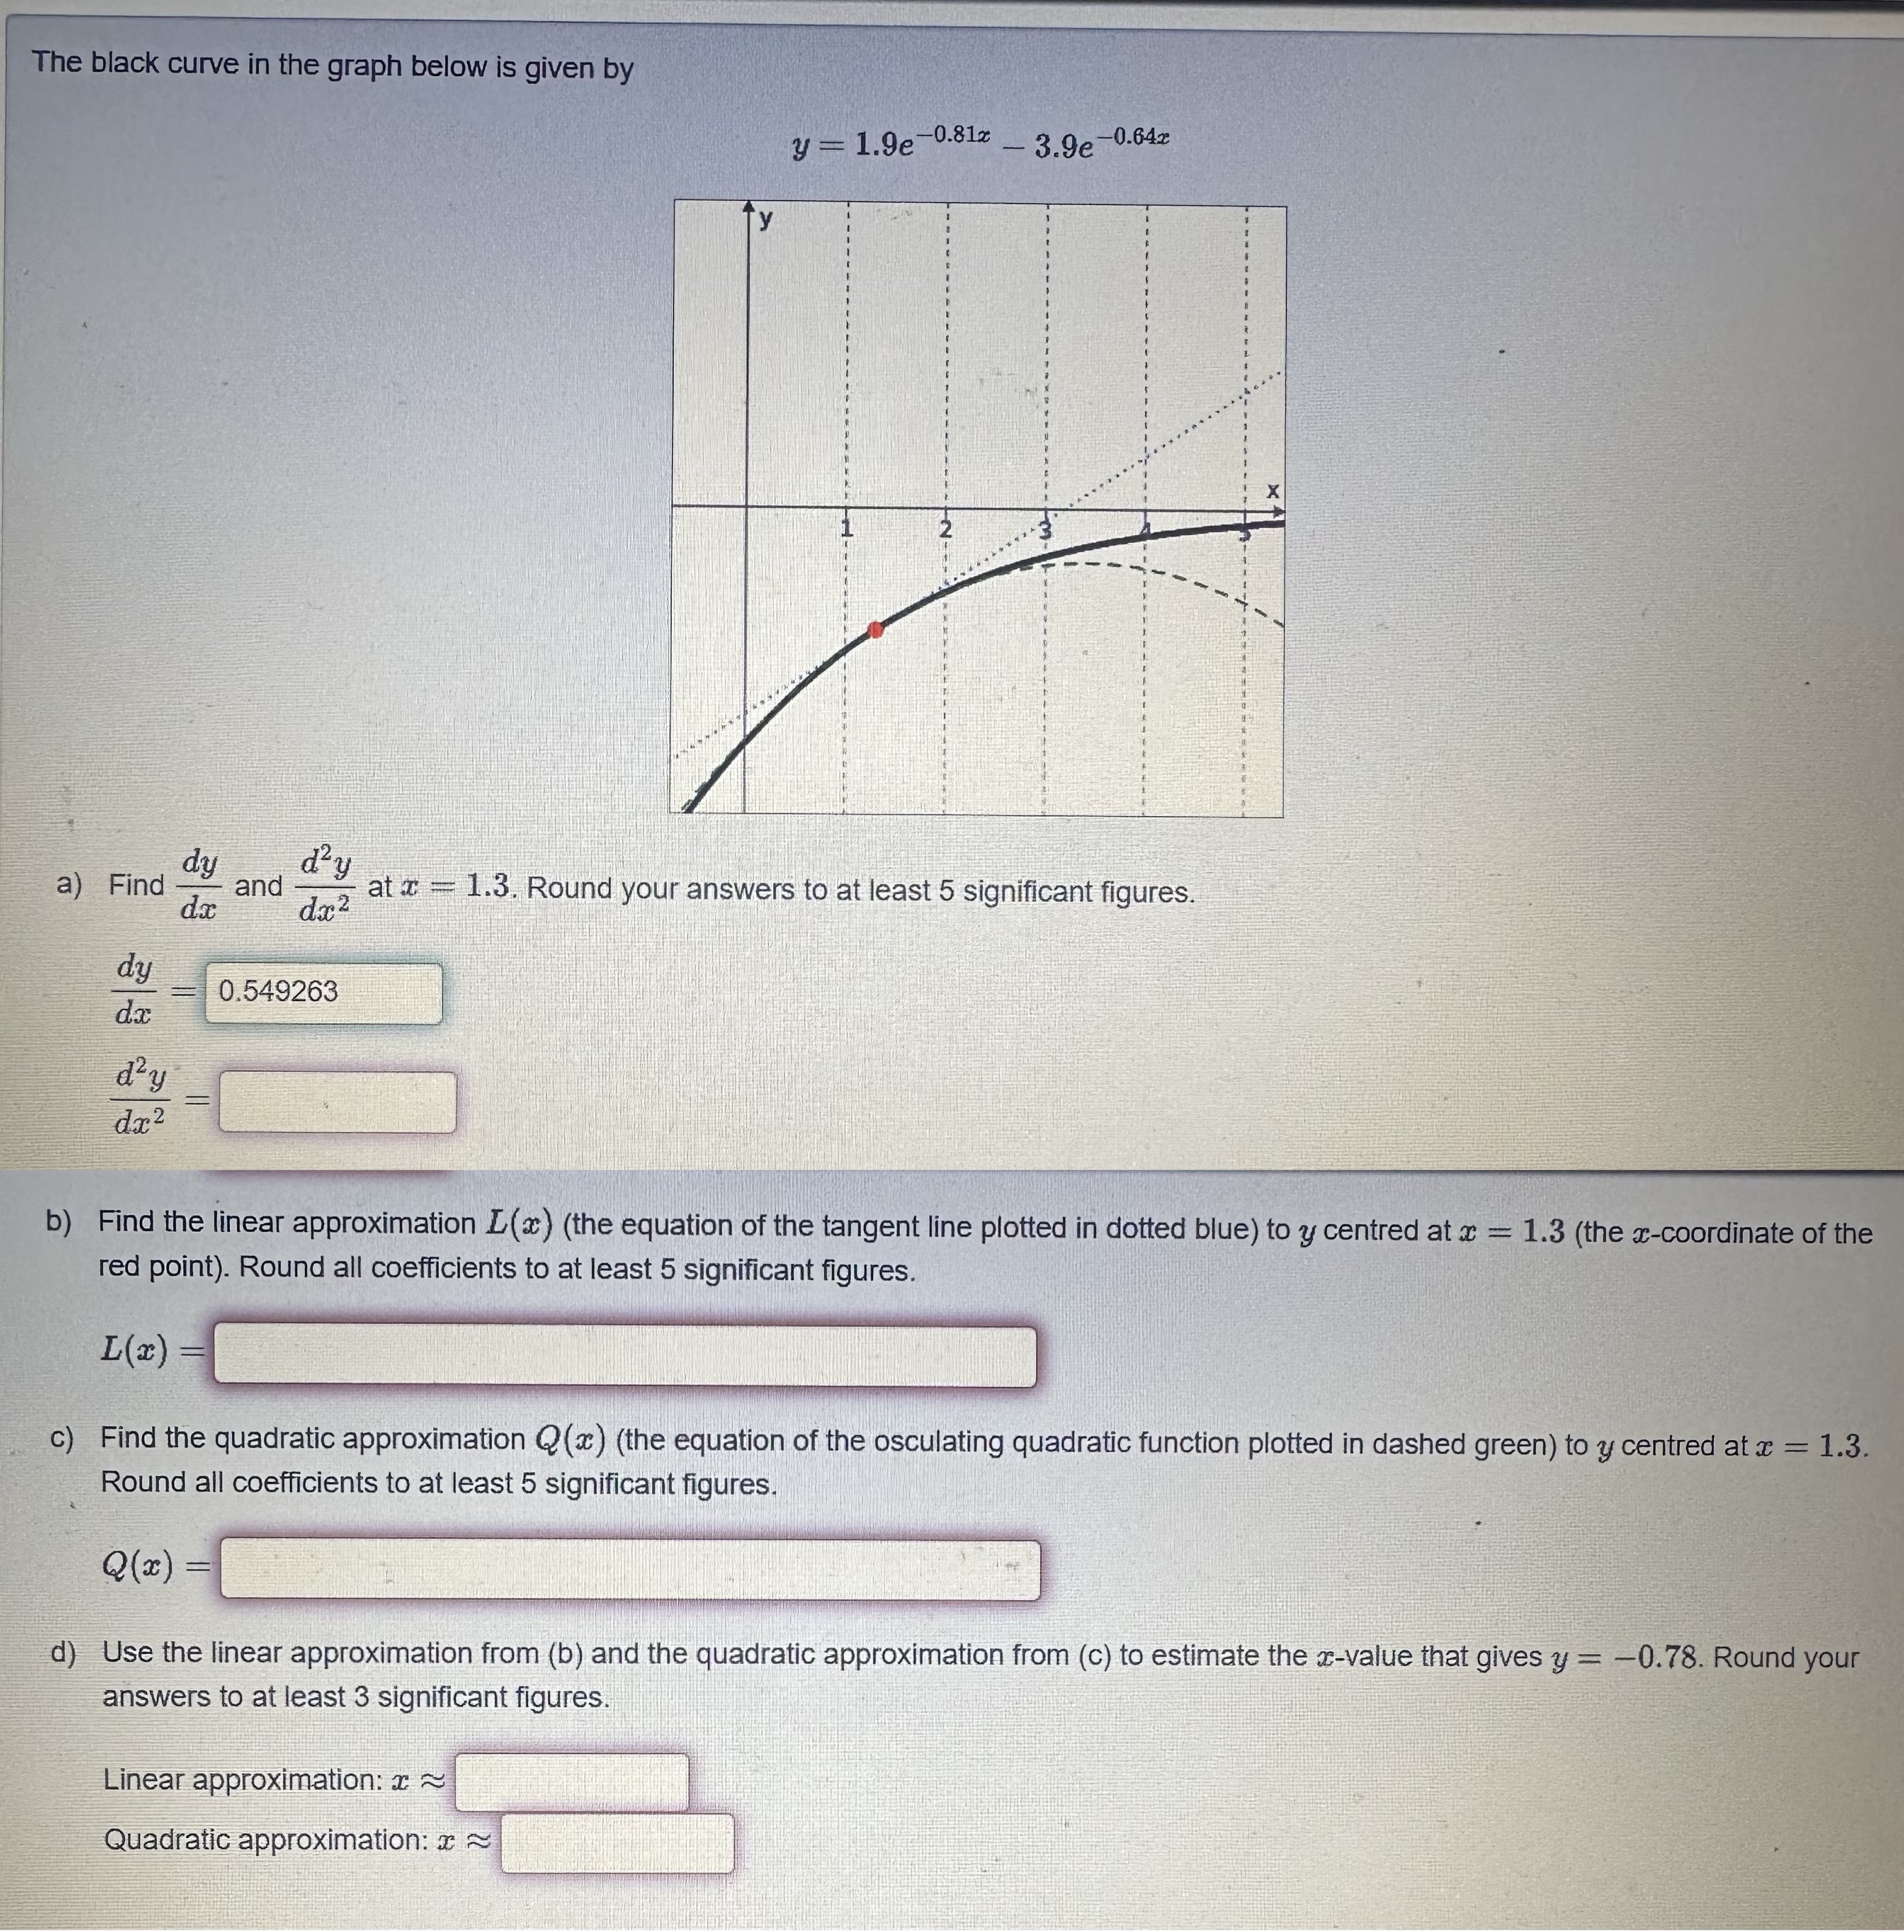
The black curve in the graph below is given by
a Find and at Round your answers to at least significant figures.
b Find the linear approximation the equation of the tangent line plotted in dotted blue to centred at the coordinate of the red point Round all coefficients to at least significant figures.
c Find the quadratic approximation the equation of the osculating quadratic function plotted in dashed green to centred at Round all coefficients to at least significant figures.
d Use the linear approximation from b and the quadratic approximation from c to estimate the value that gives Round your answers to at least significant figures.
Linear approximation: ~~
Quadratic approximation: ~~
Step by Step Solution
There are 3 Steps involved in it
1 Expert Approved Answer
Step: 1 Unlock

Question Has Been Solved by an Expert!
Get step-by-step solutions from verified subject matter experts
Step: 2 Unlock
Step: 3 Unlock