

Question: The box plots display measures from data collected when 15 athletes were asked how many miles they ran that day. (I'll upload the images) Which
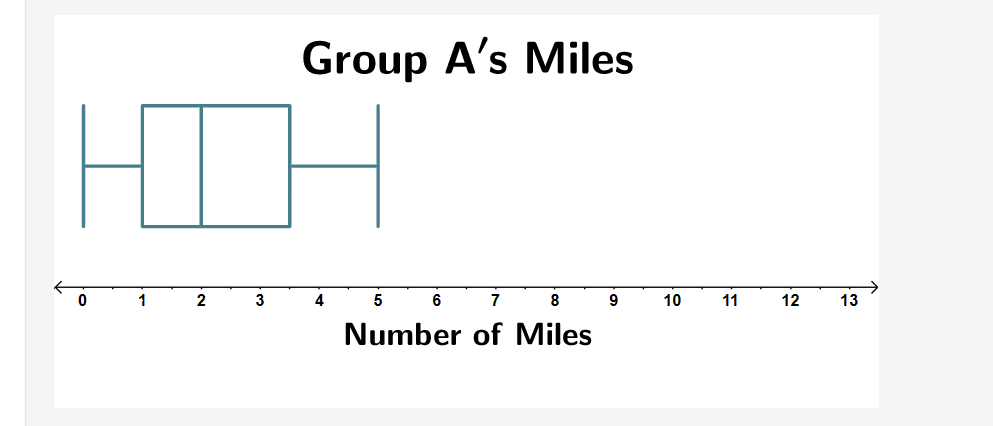
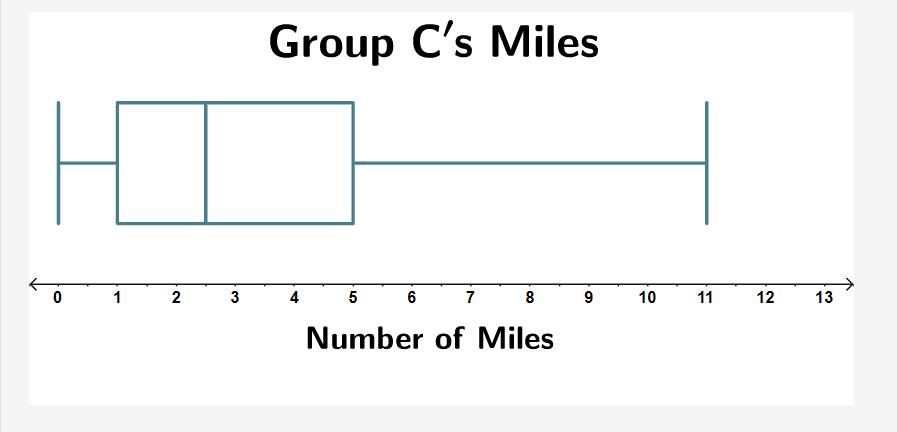
The box plots display measures from data collected when 15 athletes were asked how many miles they ran that day.
(I'll upload the images)
Which group of athletes ran theleastmiles based on the data displayed?
A) Group A, with a median value of 2 miles
B) Group C, with a median value of 2.5 miles
C)Group C, with a narrow spread in the data
D)Group A, with a wide spread in the data
\f\f
Step by Step Solution
There are 3 Steps involved in it
1 Expert Approved Answer
Step: 1 Unlock

Question Has Been Solved by an Expert!
Get step-by-step solutions from verified subject matter experts
Step: 2 Unlock
Step: 3 Unlock