

Question: The boxplot below represents the number of errors made during a given month for a sample of 20 employees at a manufacturing plant. Identify the
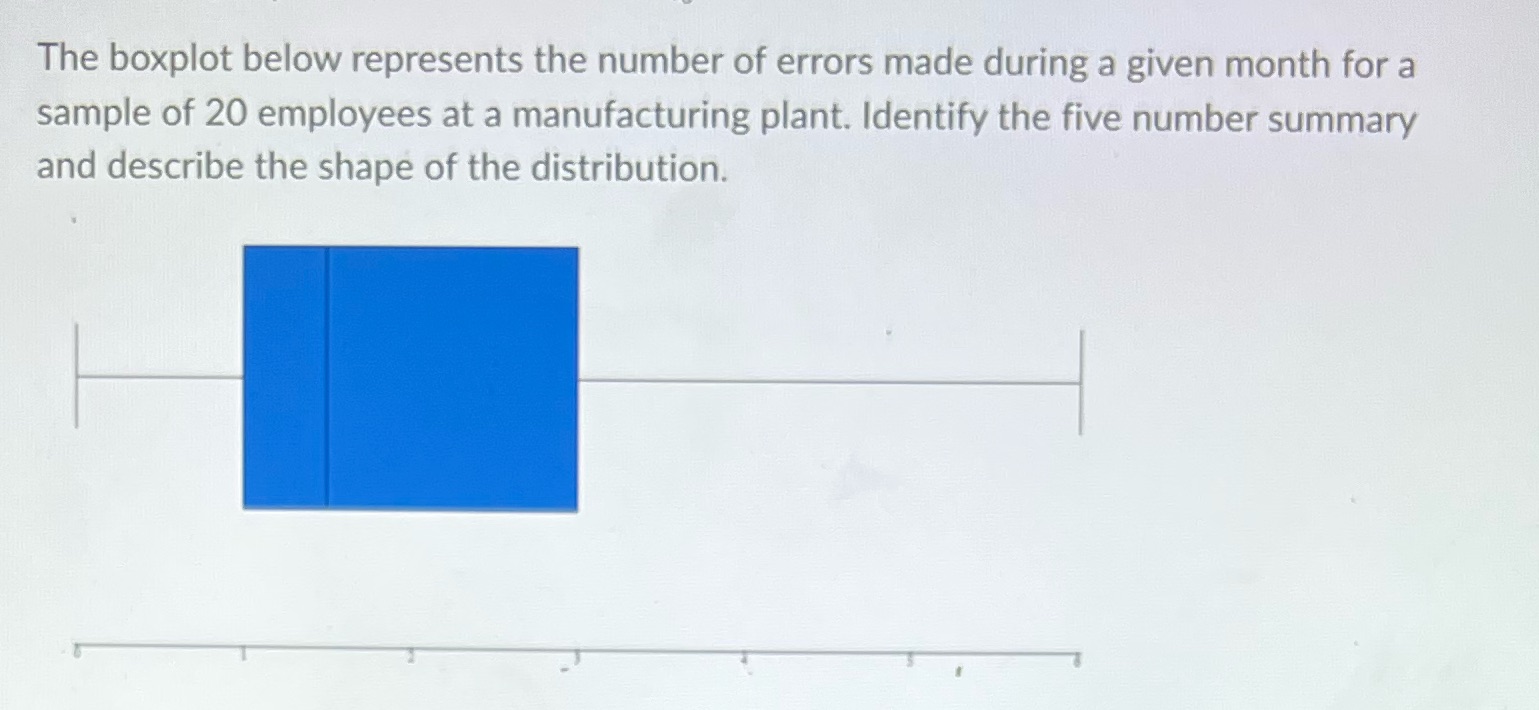
The boxplot below represents the number of errors made during a given month for a sample of 20 employees at a manufacturing plant. Identify the five number summary and describe the shape of the distribution
Step by Step Solution
There are 3 Steps involved in it
1 Expert Approved Answer
Step: 1 Unlock

Question Has Been Solved by an Expert!
Get step-by-step solutions from verified subject matter experts
Step: 2 Unlock
Step: 3 Unlock