

Question: The boxplot below shows salaries for Construction workers and Teachers. Construction Teacher 20 25 30 35 40 45 50 55 60 Salary (thousands of $)
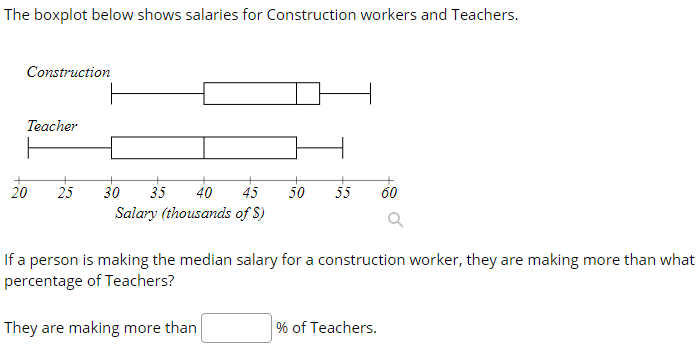
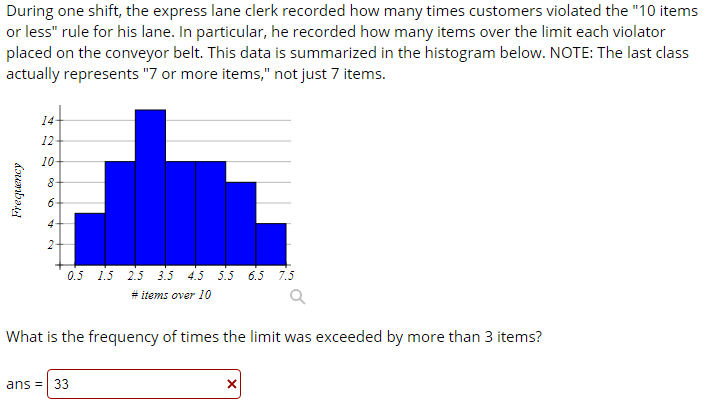
The boxplot below shows salaries for Construction workers and Teachers. Construction Teacher 20 25 30 35 40 45 50 55 60 Salary (thousands of $) Q If a person is making the median salary for a construction worker, they are making more than what percentage of Teachers? They are making more than % of Teachers.During one shift, the express lane clerk recorded how many times customers violated the "10 items or less" rule for his lane. In particular, he recorded how many items over the limit each violator placed on the conveyor belt. This data is summarized in the histogram below. NOTE: The last class actually represents "7 or more items," not just 7 items. 14 12 10 Frequency 0.5 1.5 2.5 3.5 4.5 5.5 6.5 7.5 # items over 10 Q What is the frequency of times the limit was exceeded by more than 3 items? ans = 33 X
Step by Step Solution
There are 3 Steps involved in it

Get step-by-step solutions from verified subject matter experts