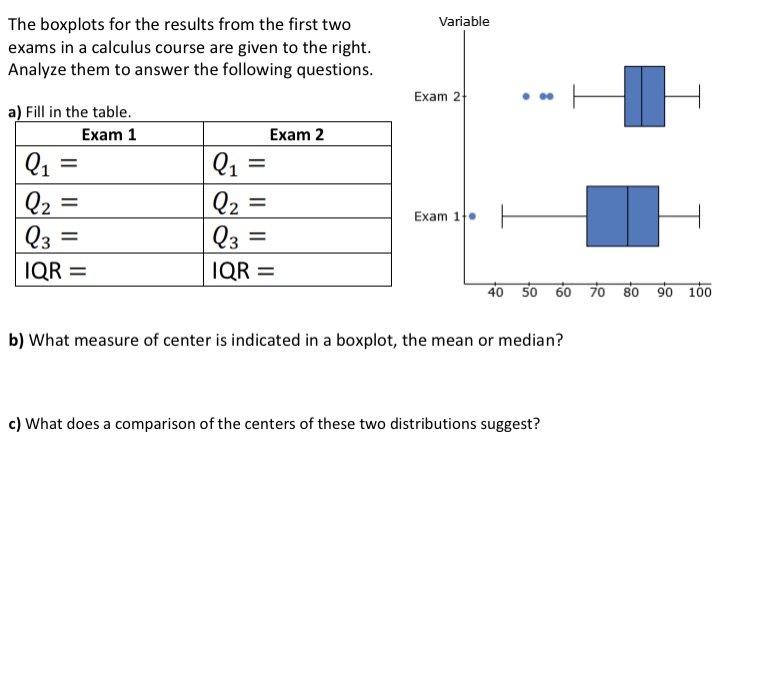
Question: The boxplots for the results from the first two Variable exams in a calculus course are given to the right. Analyze them to answer the

The boxplots for the results from the first two
The boxplots for the results from the first two Variable exams in a calculus course are given to the right. Analyze them to answer the following questions. Exam 2 a) Fill in the table. Exam 1 Exam 2 Q1 = Q1= Q2 = Q2 = Exam 1 0 Q3 = Q3 = IQR = IQR = 40 50 60 70 80 90 100 b) What measure of center is indicated in a boxplot, the mean or median? c) What does a comparison of the centers of these two distributions suggest

Step by Step Solution

There are 3 Steps involved in it

1 Expert Approved Answer
Step: 1 Unlock blur-text-image
Question Has Been Solved by an Expert!

Get step-by-step solutions from verified subject matter experts

Step: 2 Unlock
Step: 3 Unlock

Students Have Also Explored These Related Mathematics Questions!