Question: The Brick Wall - Case Study 9.1 Scenario: It is now time to reexamine the brick wall example from this chapter. That example must be
The Brick Wall - Case Study 9.1
Scenario:
It is now time to reexamine the brick wall example from this chapter. That example must be referred to while addressing this case study. It is now the end of day 3, the day of rain that caused the effort to fall behind schedule and indicate cost overrun. Decisions must be made as to whether to accelerate the project to ensure that it finishes on schedule or possible to intentionally delay it to try to recover some of the cost overrun by using only the most efficient workers. The key to this decision will be accurate forecasts of what the cost and schedule will be for each of these scenarios. In other words, an Estimate at Completion (EAC) must be developed for Case A. Your assignment then is to generate an EAC based on the following:
Case A: To finish on day 4, the remaining work may need to be done on overtime. The pay rate for overtime is time and a half, i.e. 50% higher than for straight time. Choosing this alternative would be appropriate if this is a schedule-critical project (i.e. it is imperative that the project finishes on time, even if costs increase as a result).
Question:
Develop an Estimate at Completion (EAC) for Case A
The Brick Wall Reference
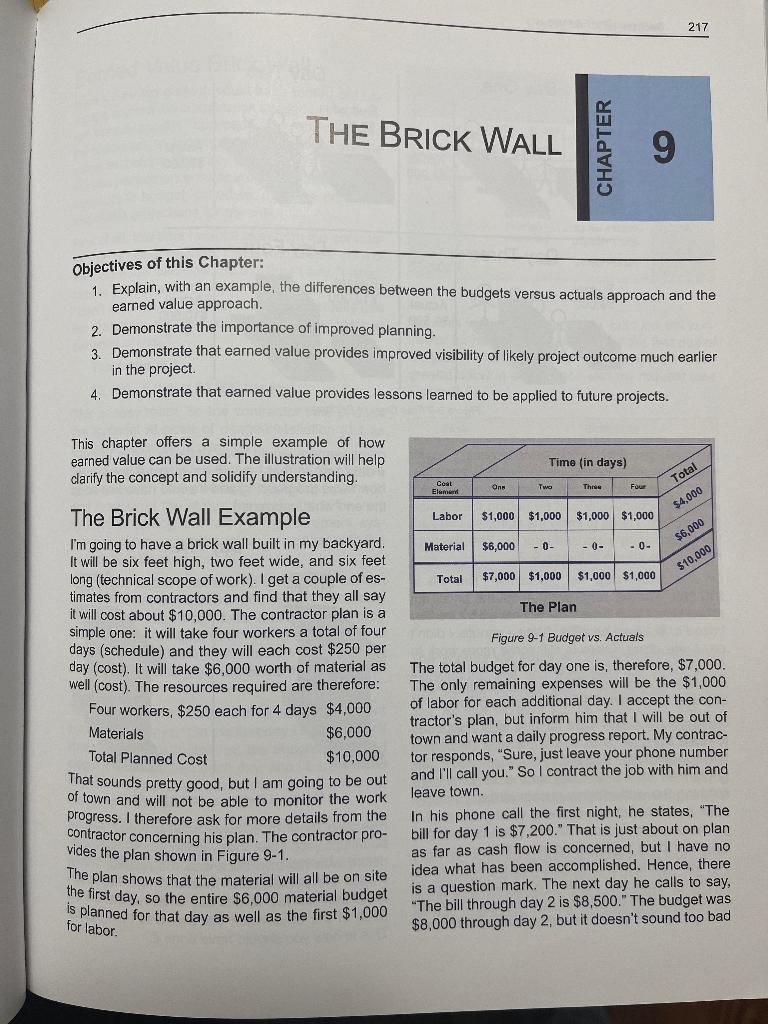
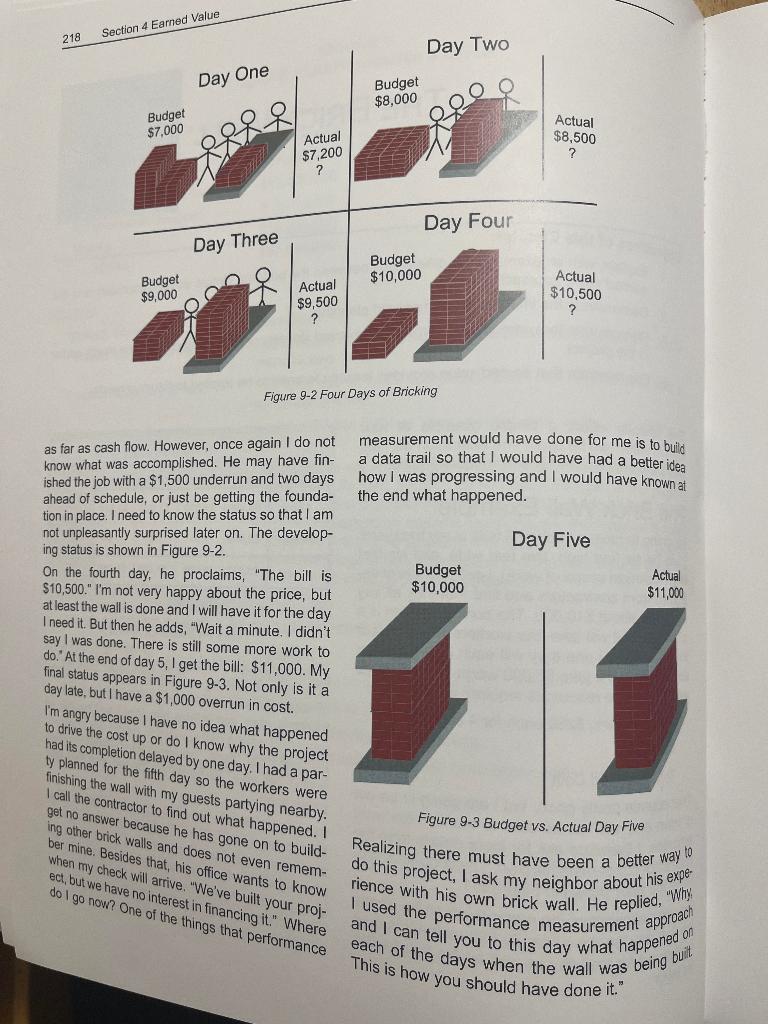
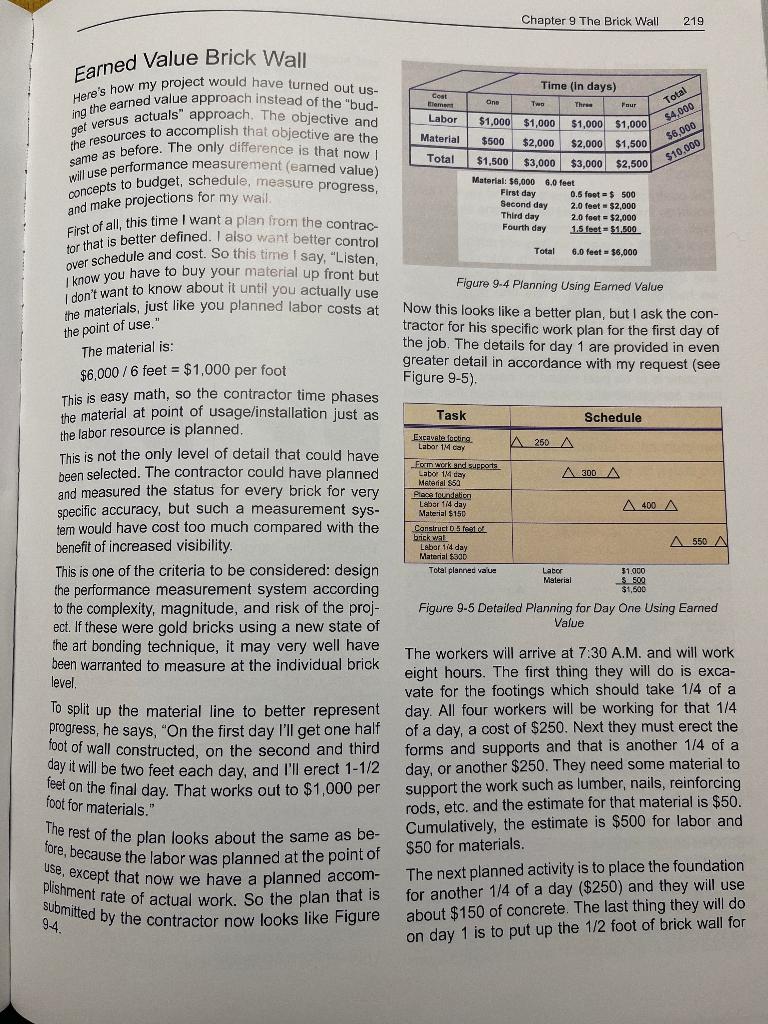

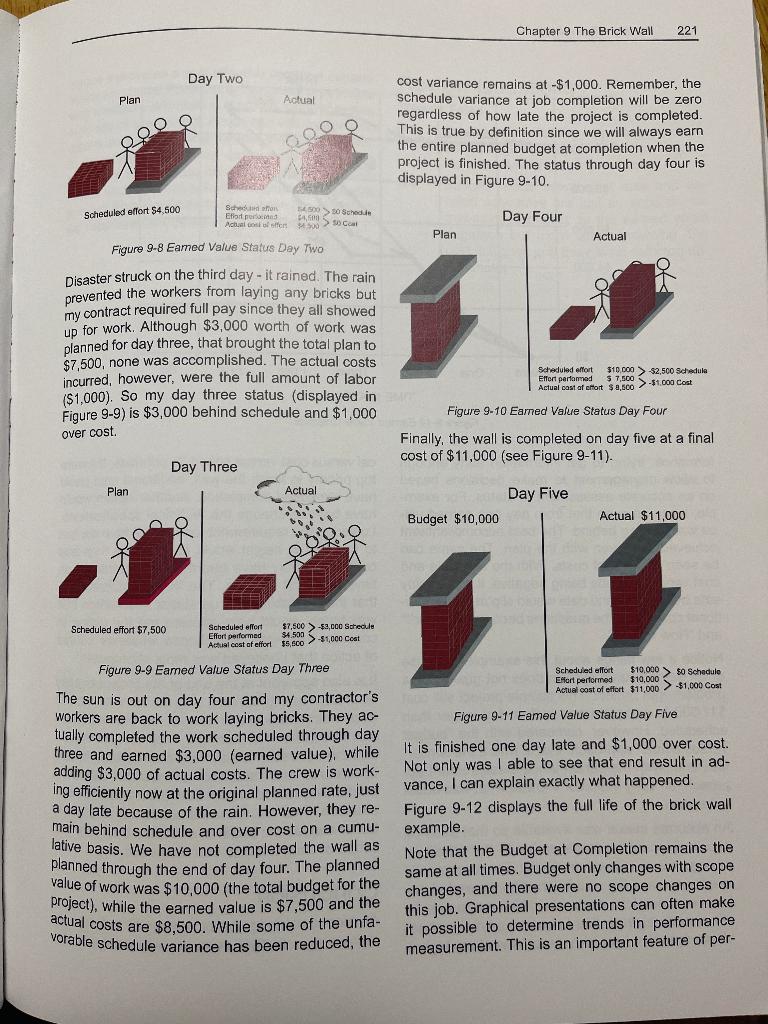
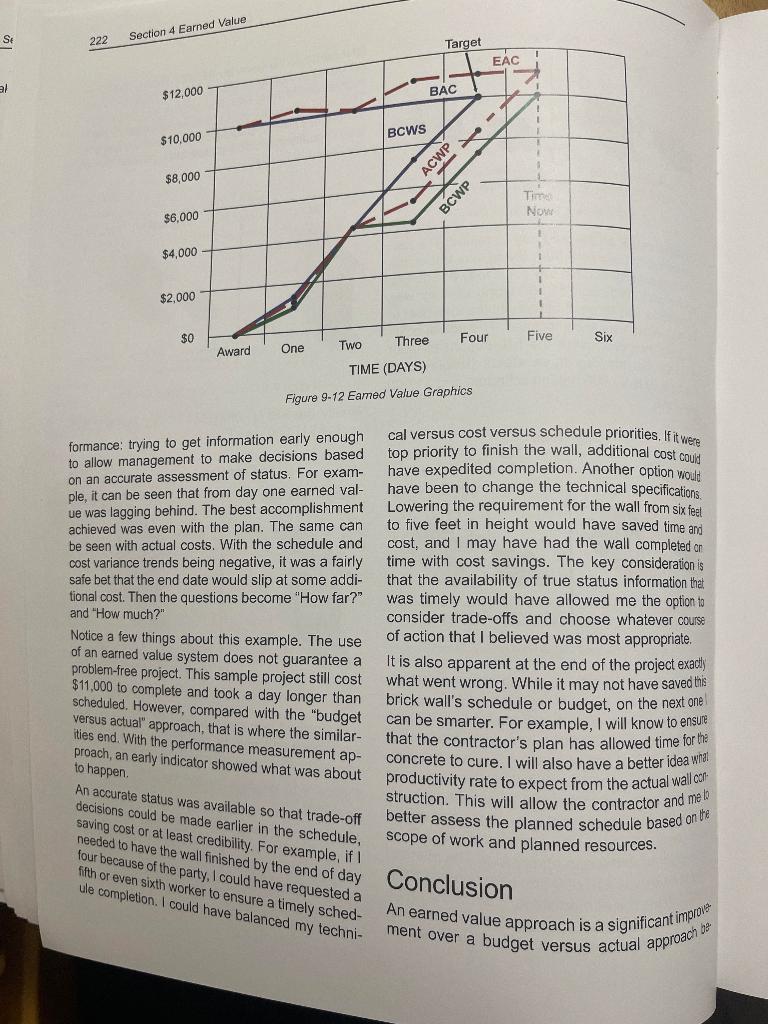
217 THE BRICK WALL CHAPTER Objectives of this Chapter: 1. Explain, with an example, the differences between the budgets versus actuals approach and the earned value approach. 2. Demonstrate the importance of improved planning. 3. Demonstrate that earned value provides improved visibility of likely project outcome much earlier in the project. 4. Demonstrate that earned value provides lessons learned to be applied to future projects. This chapter offers a simple example of how earned value can be used. The illustration will help clarify the concept and solidify understanding. Time (in days) Total Coat Elumu Ons Two Thne Four $4,000 Labor $1,000 $1,000 $1,000 $1,000 $6,000 Material $6,000 0 -0- -0- $10,000 Total $7,000 $1,000 $1,000 $1,000 The Plan The Brick Wall Example I'm going to have a brick wall built in my backyard. It will be six feet high, two feet wide, and six feet long (technical scope of work). I get a couple of es- timates from contractors and find that they all say it will cost about $10,000. The contractor plan is a simple one: it will take four workers a total of four days (schedule) and they will each cost $250 per day (cost). It will take $6,000 worth of material as well (cost). The resources required are therefore: Four workers, $250 each for 4 days $4,000 Materials $6,000 Total Planned Cost $10,000 That sounds pretty good, but I am going to be out town and will not be able to monitor the work progress. I therefore ask for more details from the contractor concerning his plan. The contractor pro- vides the plan shown in Figure 9-1. The plan shows that the material will all be on site the first day, so the entire $6,000 material budget is planned for that day as well as the first $1,000 Figure 9-1 Budget vs. Actuals The total budget for day one is, therefore, $7,000. The only remaining expenses will be the $1,000 of labor for each additional day. I accept the con- tractor's plan, but inform him that I will be out of town and want a daily progress report. My contrac- tor responds, "Sure, just leave your phone number and I'll call you." So I contract the job with him and leave town. In his phone call the first night, he states, "The bill for day 1 is $7,200." That is just about on plan as far as cash flow is concerned, but I have no idea what has been accomplished. Hence, there is a question mark. The next day he calls to say, "The bill through day 2 is $8,500." The budget was $8,000 through day 2, but it doesn't sound too bad for labor. 218 Section 4 Earned Value Day Two Day One Budget $8,000 Budget $7,000 Actual $8,500 Actual $7,200 ? Day Four Day Three Budget $10,000 Budget $9,000 Actual $10,500 Actual $9,500 ? Figure 9-2 Four Days of Bricking measurement would have done for me is to build a data trail so that I would have had a better idea how I was progressing and I would have known at the end what happened. Day Five as far as cash flow. However, once again I do not know what was accomplished. He may have fin- ished the job with a $1,500 underrun and two days ahead of schedule, or just be getting the founda- tion in place. I need to know the status so that I am not unpleasantly surprised later on. The develop- ing status is shown in Figure 9-2. On the fourth day, he proclaims, "The bill is $10,500." I'm not very happy about the price, but at least the wall is done and I will have it for the day I need it. But then he adds, "Wait a minute. I didn't say I was done. There is still some more work to do. At the end of day 5, I get the bill: $11,000. My Budget $10,000 Actual $11,000 final status appears in Figure 9-3. Not only is it a day late, but I have a $1,000 overrun in cost. I'm angry because I have no idea what happened to drive the cost up or do I know why the project had its completion delayed by one day. I had a par- ty planned for the fifth day so the workers were finishing the wall with my guests partying nearby. I call the contractor to find out what happened. I get no answer because he has gone on to build- ing other brick walls and does not even remem- ber mine. Besides that, his office wants to know when my check will arrive. "We've built your proj- ect, but we have no interest in financing it." Where dolgo now? One of the things that performance Figure 9-3 Budget vs. Actual Day Five do this project, I ask my neighbor about his expe- Realizing there must have been a better way to rience with his own brick wall. He replied, "Why I used the performance measurement approach and I can tell you to this day what happened on each of the days when the wall was being built This is how you should have done it." Chapter 9 The Brick Wall 219 Time (in days) One Two Three Four Coat tlement Labor Material Total $4,000 $6,000 Total $10,000 Earned Value Brick Wall Here's how my project would have turned out us- ing the earned value approach instead of the "bud- get versus actuals approach. The objective and the resources to accomplish that objective are the same as before. The only difference is that now will use performance measurement (earned value) concepts to budget, schedule, measure progress, and make projections for my wall. First of all, this time I want a plan from the contrac- for that is better defined. I also want better control over schedule and cost. So this time I say, "Listen, I know you have to buy your material up front but I don't want to know about it until you actually use the materials, just like you planned labor costs at $1,000 $1,000 $1,000 $1,000 $500 $2,000 $2,000 $1,500 $1,500 $3,000 $3,000 $2,500 Material: $6.000 6.0 feet First day 0.5 feet = $ 500 Second day 2.0 feet-$2,000 Third day 2.0 feet = $2,000 Fourth day 1.5 feet - $1,500 Total 6.0 feet - $6,000 the point of use." Figure 9.4 Planning Using Earned Value Now this looks like a better plan, but I ask the con- tractor for his specific work plan for the first day of the job. The details for day 1 are provided in even greater detail in accordance with my request (see Figure 9-5). Task Schedule Excavata focbira Labar 1M cay A 250 A Formwork and supports Labor 1M day A300 A Material $50 Place foundation Labor 1/4 day A400 A Material $150 Constructie brick wal 550 Labor 114 day Material $300 Total planned value Lator 31.000 Material S.500 $1,500 Figure 9-5 Detailed Planning for Day One Using Earned Value The material is: $6,000 / 6 feet = $1,000 per foot This is easy math, so the contractor time phases the material at point of usage/installation just as the labor resource is planned. This is not the only level of detail that could have been selected. The contractor could have planned and measured the status for every brick for very specific accuracy, but such a measurement sys- tem would have cost too much compared with the benefit of increased visibility. This is one of the criteria to be considered: design the performance measurement system according to the complexity, magnitude, and risk of the proj- ect. If these were gold bricks using a new state of the art bonding technique, it may very well have been warranted to measure at the individual brick level. To split up the material line to better represent progress, he says, "On the first day I'll get one half foot of wall constructed, on the second and third day it will be two feet each day, and I'll erect 1-1/2 feet on the final day. That works out to $1,000 per foot for materials." The rest of the plan looks about the same as be- fore, because the labor was planned at the point of use, except that now we have a planned accom- plishment rate of actual work. So the plan that is submitted by the contractor now looks like Figure The workers will arrive at 7:30 A.M. and will work eight hours. The first thing they will do is exca- vate for the footings which should take 1/4 of a day. All four workers will be working for that 1/4 of a day, a cost of $250. Next they must erect the forms and supports and that is another 1/4 of a day, or another $250. They need some material to support the work such as lumber, nails, reinforcing rods, etc. and the estimate for that material is $50. Cumulatively, the estimate is $500 for labor and $50 for materials. The next planned activity is to place the foundation for another 1/4 of a day ($250) and they will use about $150 of concrete. The last thing they will do on day 1 is to put up the 1/2 foot of brick wall for 94. 220 Section 4 Earned Value which they will use another 1/4 of a day ($250) and the materials for this will cost $300. The contractor says, "That's how I plan to build this wall. I have $1,000 worth of labor and $500 of ma- terials, or $1,500 total for the day." I say, "It sounds good. Call me tomorrow and let me know how it's was budgeted at $400, so I also earn $400 for hver and support task. I completed the foundation that task despite $250 extra cost for labor for the last two hours of the day in which no effort was per formed). This brought the actual cost to $650 for that task. However, I didn't get any bricks laid, so there is no earned value for that task. The planned value for that last task was $550, so I am schedule by $550. What was the cost for the first behind day? The actual cost was $1,250 for the first day, versus a plan to do $1,500 of work and an eamed it is costing me more than planned. Most of the value of $950. The wall is behind schedule and the concrete hardening time. Status is shown Dic problem is because of the oversight concerning torially in Figure 9-7. going." The contractor calls the next day and says, "I said I would do the footings and they're done as planned. Well, they cost a little more than expected ($300 versus $250 planned) but they are done. Also, we finished the forms and supports right on schedule and budget. Next we placed the foundation, but we had a little problem. I had one of my people draw up the original plan and there was an over- sight I didn't catch. The concrete in the foundation has to harden before we can start laying bricks, so we didn't get any bricks laid. The problem is my crew is to be paid based on hours rather than tasks completed and they have a rule that says we have to pay them for a full day, even if no work is available. So the foundation cost 1/4 day more than planned or an extra $250." The status for day 1 is shown in Figure 9-6. Day One Plan Actual 009 Scheduled effort $1,500 Scheduled effort $1.500 Effort Performed ost of effort $1.250.00 - Actual cosa Task Schedule 250 (P) 300 (A) Figure 9-7 Earned Value Status Day One 250 (8) 300/S Falling Labor 14 day Eym work and suppor Labor 14 Material $50 Place Medalion Labor 14 day Materials Contos be Labar 1 cay Waterial 1300 300 (P) Concrete 300 (A) curing 400 (S) ------- 400 (P) 850 (A) 550 (S) A O(P) O(A) Actual Cost (A) $ 300 300 650 Performed (P) Scheduled Es $ 250 Forme 300 Foundation 400 Brick 150 Total 1991 $250 300 400 3950 $1250 Figure 9-6 Eamed Value After Day One So the progress of my wall at the end of day one is this: I first planned to excavate and this was completed, so learn the full $250 budget that was planned for this work even though I consumed $300 in actual costs to accomplish the excavation task The schedule variance, as shown, is -$550 and the cost variance is $300. Both of these repre sent unfavorable status. Had I used the tradition al approach of budget versus actual cost ($1,500 versus $1,250), I would not have been concerned because it was so early in the project that there would have been adequate time to recover. I rea- ize that I am, on a percentage basis, significantly behind schedule and over cost. After those first day results, that night I gave my contractor an earful of complaints. This must have been a successful motivation al speech, because the news was much better when he called the next day. The workers erected 2.5 feet of wall on that second day. Not only had the crew caught up to the schedule, but they had worked efficiently and eliminated the unfavorable cost variance as well. So at the end of day two, my to $4,500. This is shown in Figure 9-8. At this point plan, earned value, and actual cost were all equal Next planned to complete the forms and supports at a value of $300. This was also completed, so my eamed value for form work is $300, and I con- sumed $300 in actual cost to accomplish the forms I am back on schedule and within budget. Chapter 9 The Brick Wall 221 Day Two Plan Actual cost variance remains at -$1,000. Remember, the schedule variance at job completion will be zero regardless of how late the project is completed. This is true by definition since we will always earn the entire planned budget at completion when the project is finished. The status through day four is displayed in Figure 9-10. Son Scheduled effort 54 500 Ctor pungen 14.500 > 50 Sched 500 AMSC Day Four Plan Actual Figure 9-8 Eamed Value Status Day Two Disaster struck on the third day - it rained. The rain prevented the workers from laying any bricks but my contract required full pay since they all showed up for work. Although $3,000 worth of work was planned for day three, that brought the total plan to $7,500, none was accomplished. The actual costs incurred, however, were the full amount of labor ($1,000). So my day three status (displayed in Figure 9-9) is $3,000 behind schedule and $1,000 Scheduled effort $10.000 >$2,500 Schedule Effort perfomed 57.500-$1.000 cost Actual cast of tort $ 9.500 over cost. Figure 9-10 Earned Value Status Day Four Finally, the wall is completed on day five at a final cost of $11,000 (see Figure 9-11). Day Three Plan Actual Day Five Budget $10,000 Actual $11,000 Scheduled effort $7,500 Scheduled effort $7,500 $3,000 Schedule Effort performed 84.500 Actual cost of effort S5 SCO>-$1,000 Cost Figure 9-9 Eamed Value Status Day Three $10.000 Schedule Scheduled effort Effort performed $10,000 Actual cost of effort $11,000-$1,000 Cost Figure 9-11 Eamed Value Status Day Five The sun is out on day four and my contractor's workers are back to work laying bricks. They ac- tually completed the work scheduled through day three and earned $3,000 (earned value), while adding $3,000 of actual costs. The crew is work- ing efficiently now at the original planned rate, just a day late because of the rain. However, they re- main behind schedule and over cost on a cumu- lative basis. We have not completed the wall as planned through the end of day four. The planned value of work was $10,000 (the total budget for the project), while the earned value is $7,500 and the actual costs are $8,500. While some of the unfa- Vorable schedule variance has been reduced, the It is finished one day late and $1,000 over cost. Not only was able to see that end result in ad- vance, I can explain exactly what happened. Figure 9-12 displays the full life of the brick wall example. Note that the Budget at Completion remains the same at all times. Budget only changes with scope changes, and there were no scope changes on this job. Graphical presentations can often make it possible to determine trends in performance measurement. This is an important feature of per- SE 222 Section 4 Earned Value Target EAC al $12,000 BAC BCWS $10,000 CW $8,000 BCWP Tim Nowe $6,000 $4,000 1 $2,000 $0 Five Six Award One Two Three Four TIME (DAYS) Figure 9-12 Eamed Value Graphics formance: trying to get information early enough to management to make decisions based on an accurate assessment of status. For exam- ple, it can be seen that from day one earned val- ue was lagging behind. The best accomplishment achieved was even with the plan. The same can be seen with actual costs. With the schedule and cost variance trends being negative, it was a fairly safe bet that the end date would slip at some addi- tional cost. Then the questions become "How far?" and "How much?" Notice a few things about this example. The use of an earned value system does not guarantee a problem-free project. This sample project still cost $11,000 to complete and took a day longer than scheduled. However, compared with the "budget versus actual" approach, that is where the similar- ities end. With the performance measurement ap- proach, an early indicator showed what was about cal versus cost versus schedule priorities. If it were top priority to finish the wall, additional cost coun have expedited completion. Another option would have been to change the technical specifications. Lowering the requirement for the wall from six feet to five feet in height would have saved time and cost, and I may have had the wall completed on time with cost savings. The key consideration is that the availability of true status information that was timely would have allowed me the option to consider trade-offs and choose whatever course of action that I believed was most appropriate. It is also apparent at the end of the project exactly what went wrong. While it may not have saved this brick wall's schedule or budget, on the next one can be smarter. For example, I will know to ensure that the contractor's plan has allowed time for the concrete to cure. I will also have a better idea what productivity rate to expect from the actual wall.com struction. This will allow the contractor and meb better assess the planned schedule based on the scope of work and planned resources. to happen An accurate status was available so that trade-off decisions could be made earlier in the schedule, saving cost or at least credibility. For example, if I needed to have the wall finished by the end of day Conclusion four because of the party, I could have requested a fifth or even sixth worker to ensure a timely sched- ule completion. I could have balanced my techni- An earned value approach is a significant improve ment over a budget versus actual approach be R Tru 9- cause it provides a cost effective common denom- inator for status. Planning to the extent practicable with available information is crucial to the eventual success of any project. An earned value approach allows an early warning system that should result in schedule and/or cost savings. It also allows trade-offs to be made between technical require- ments and cost and schedule objectives. Lessons learned from a system that provides for an histori- cal data base will benefit future projects. 9


