

Question: The Capacitor lab RESULTS Please help me with the graph Experimental Procedure and Data Taking for Activity I: After aligning the plates, they were moved
The Capacitor lab RESULTS Please help me with the graph
Experimental Procedure and Data Taking for Activity I: After aligning the plates, they were moved to the end of the track. The purpose of this set up was to determine the wire capacitance Co. The value of Cw is very small. Equation 2 shows that capacitance is inverse proportional to the distance between the plates. If the distance between plates is very large, C approaches zero. What does not approach zero, is the capacitance of the wires. This value is an estimate for the wire capacitance. It must be subtracted from all measurements so that the recorded values only reflect the capacitance of the plates. Starting with a separation between plates of 0.5 cm the capacitance was recorded. The separation of the plates was increased in steps of 0.5 cm up to 4 cm.
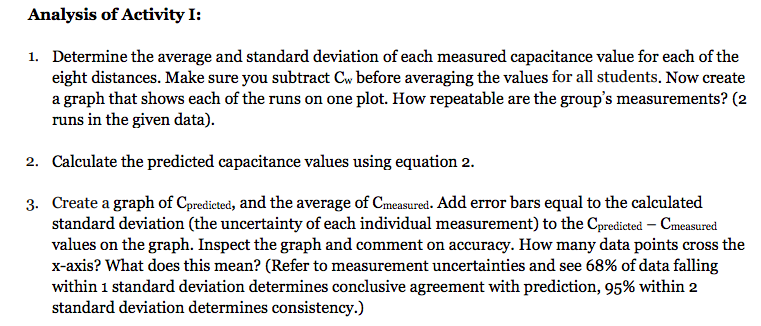
Analysis of Act}? I: 1. Determine the average and standard deviation of each measured capacitance value for each of the eight distances. Make sure you subtract Cw before averaging the values for all students. Now create a graph that shows each of the runs on one plot. How repeatable are the group's measurements? [2 runs in the given data). 2. Calculate the predicted capacitance values using equation 2. 3. Create a graph of Cyndi-me, and the average of Cmt-asurt-d. Add error bars equal to the calculated standard deviation (the uncertainty of each individual measurement} to the Cprcdich-d Uninsured values on the graph. Inspect the graph and comment on accuracy. Ilow man},r data points cross the xaxis? What does this mean? [Refer to measurement uncertainties and see 53% of data falling within 1 standard deviation determines conclusive agreement with prediction, 95% within 2 standard deviation determines consistency.)
Step by Step Solution
There are 3 Steps involved in it

Get step-by-step solutions from verified subject matter experts