

Question: The CAPM model can be written as E(R) = Rf + Beta*(Rm-Rf) Where E(R) is the expected return of the firm Rf is the risk-free
The CAPM model can be written as
E(R) = Rf + Beta*(Rm-Rf)
Where
- E(R) is the expected return of the firm
- Rf is the risk-free rate
- Rm is the returns of the market
The regression beta is estimated from the regression between returns of the firm as dependent variable and returns of the market as independent variable. Beta is the slope of the regression equation. The slope parameter estimated from the regression model is the beta of the CAPM model. The beta of security tells us how sensitive the securitys returns are to the market's returns. Now to obtain the beta we run a regression using the security returns as the dependent variable and excess market returns as the independent variable but at a weekly frequency. Interpret the following figures 1) regression 2) weekly returns of siemens 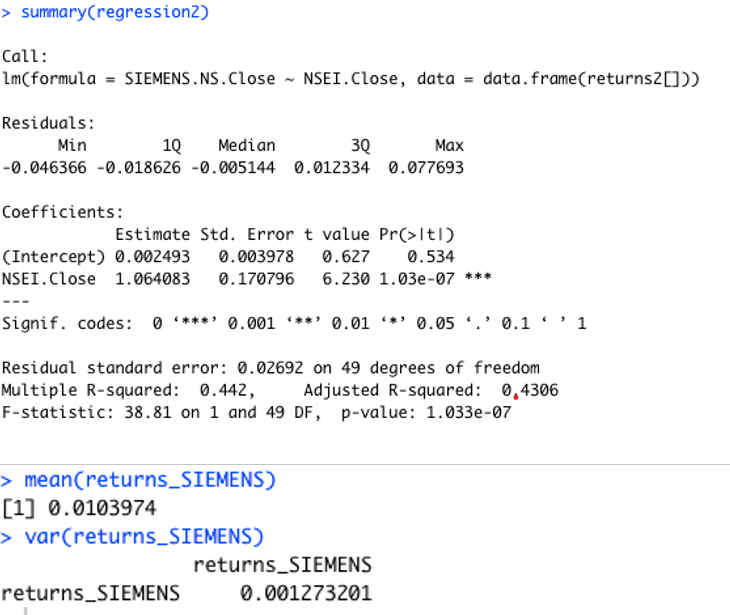
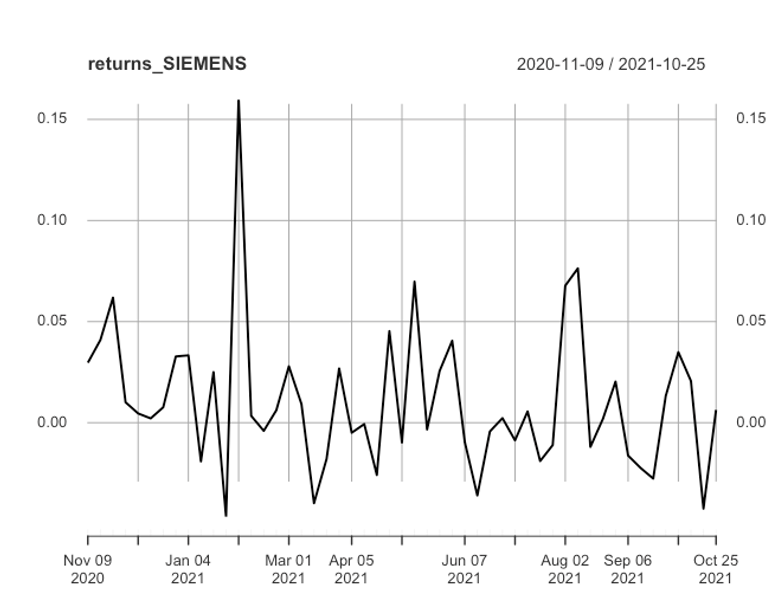
> summary(regression2) Call: Im(formula = SIEMENS.NS.Close - NSEI.Close, data = data.frame(returns2[])) Residuals: 1Q Median 30 Max -0.046366 -0.018626 -0.005144 0.012334 0.077693 Min Coefficients: Estimate Std. Error t value Pr(>ltl) (Intercept) 0.002493 0.003978 0.627 0.534 NSEI.Close 1.064083 0.170796 6.230 1.03-07 *** Signif. codes: 0 *** 0.001 *** 0.01 0.05 .' 0.1'' 1 Residual standard error: 0.02692 on 49 degrees of freedom Multiple R-squared: 0.442, Adjusted R-squared: 0.4306 F-statistic: 38.81 on 1 and 49 DF, p-value: 1.033e-07 > mean(returns_SIEMENS) [1] 0.0103974 > var (returns_SIEMENS) returns_SIEMENS returns_SIEMENS 0.001273201 returns_SIEMENS 2020-11-09 / 2021-10-25 0.15 0.15 0.10 0.10 0.05 0.05 Awamwho 0.00 0.00 Nov 09 2020 Jan 04 2021 Mar 01 Apr 05 2021 2021 Jun 07 2021 Aug 02 Sep 06 2021 2021 Oct 25 2021 > summary(regression2) Call: Im(formula = SIEMENS.NS.Close - NSEI.Close, data = data.frame(returns2[])) Residuals: 1Q Median 30 Max -0.046366 -0.018626 -0.005144 0.012334 0.077693 Min Coefficients: Estimate Std. Error t value Pr(>ltl) (Intercept) 0.002493 0.003978 0.627 0.534 NSEI.Close 1.064083 0.170796 6.230 1.03-07 *** Signif. codes: 0 *** 0.001 *** 0.01 0.05 .' 0.1'' 1 Residual standard error: 0.02692 on 49 degrees of freedom Multiple R-squared: 0.442, Adjusted R-squared: 0.4306 F-statistic: 38.81 on 1 and 49 DF, p-value: 1.033e-07 > mean(returns_SIEMENS) [1] 0.0103974 > var (returns_SIEMENS) returns_SIEMENS returns_SIEMENS 0.001273201 returns_SIEMENS 2020-11-09 / 2021-10-25 0.15 0.15 0.10 0.10 0.05 0.05 Awamwho 0.00 0.00 Nov 09 2020 Jan 04 2021 Mar 01 Apr 05 2021 2021 Jun 07 2021 Aug 02 Sep 06 2021 2021 Oct 25 2021
Step by Step Solution
There are 3 Steps involved in it

Get step-by-step solutions from verified subject matter experts