

Question: The Census at Schools program collects data each year from students enrolled in primary and secondary schools in many different countries. In a random sample

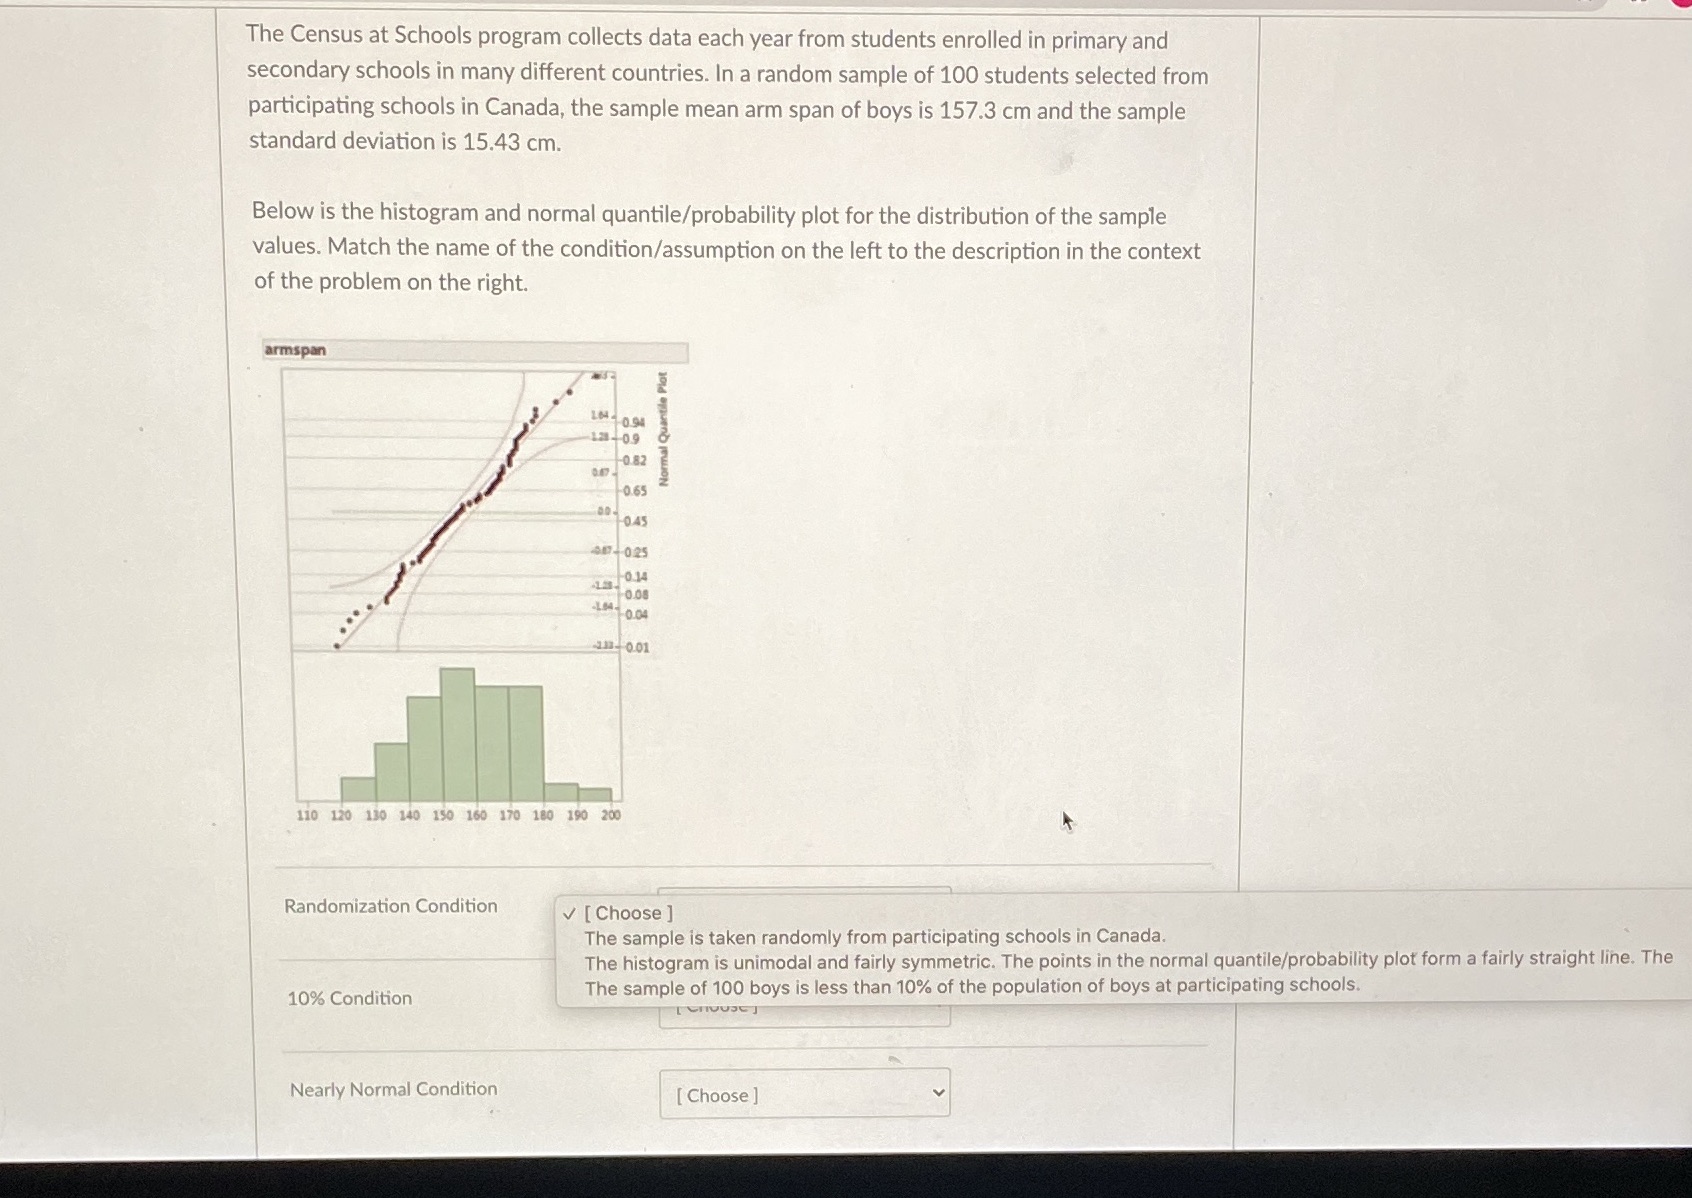
The Census at Schools program collects data each year from students enrolled in primary and secondary schools in many different countries. In a random sample of 100 students selected from participating schools in Canada, the sample mean arm span of boys is 157.3 cm and the sample standard deviation is 15.43 cm. Below is the histogram and normal quantile/probability plot for the distribution of the sample values. Match the name of the condition/assumption on the left to the description in the context of the problem on the right. armspan 10409 Final Quartile Plot 0.82 0.65 -045 5074 025 -0.14 1-0.04 313 0.01 110 120 130 140 150 160 170 180 190 200 Randomization Condition [ Choose ] The sample is taken randomly from participating schools in Canada. The histogram is unimodal and fairly symmetric. The points in the normal quantile/probability plot form a fairly straight line. The 10% Condition The sample of 100 boys is less than 10% of the population of boys at participating schools. Nearly Normal Condition [ Choose ]
Step by Step Solution
There are 3 Steps involved in it

Get step-by-step solutions from verified subject matter experts