

Question: The Central Limit Theorem can be demonstrated by taking sample mean distributions from a population that is not normally distributed. - Graph the probability distribution
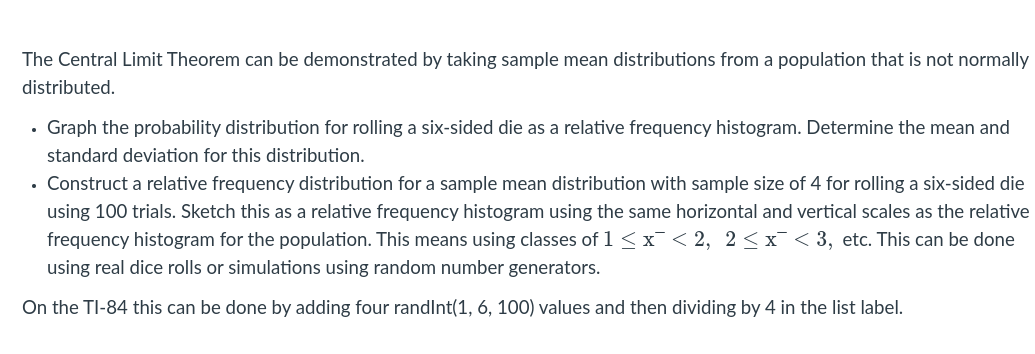
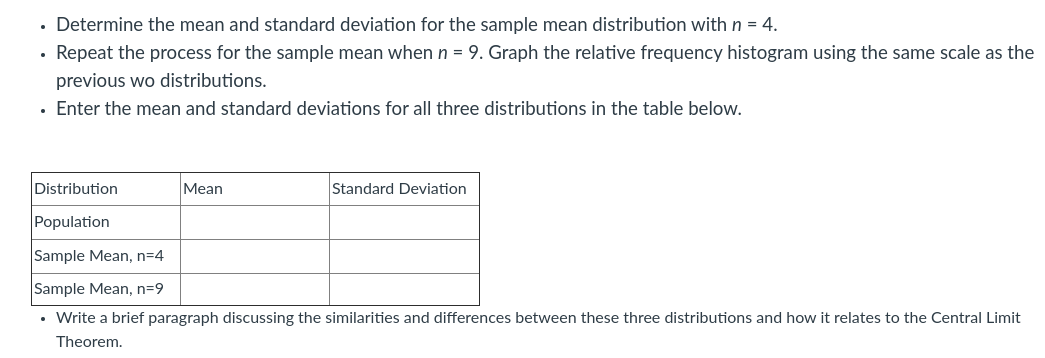
The Central Limit Theorem can be demonstrated by taking sample mean distributions from a population that is not normally distributed. - Graph the probability distribution for rolling a six-sided die as a relative frequency histogram. Determine the mean and standard deviation for this distribution. - Construct a relative frequency distribution fora sample mean distribution with sample size of 4 for rolling a six-sided die using 100 trials. Sketch this as a relative frequency histogram using the same horizontal and vertical scales as the relative frequency histogram for the population. This means using classes of 1 g :f
Step by Step Solution
There are 3 Steps involved in it
1 Expert Approved Answer
Step: 1 Unlock

Question Has Been Solved by an Expert!
Get step-by-step solutions from verified subject matter experts
Step: 2 Unlock
Step: 3 Unlock