

The chart below presents several brands plotted by people's intention to buy a brand (y-axis) and their
Question:
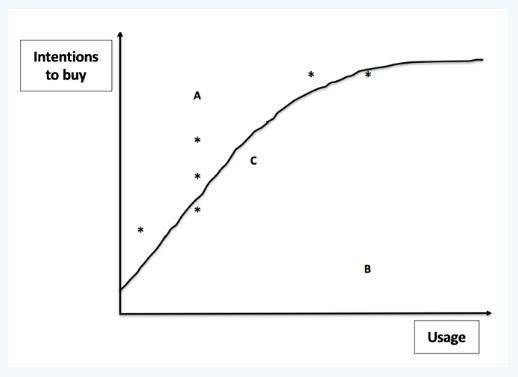
The chart below presents several brands plotted by people's intention to buy a brand (y-axis) and their actual usage of the brand (x-axis). Using knowledge about growing and dying brands and their relationship with intentions to buy vs. usage. Consider brands A, B, and C in the graph, identify which of them is a dying brand, growing brand and one that is performing as expected. Explain your answer.
Your Marketing Manager wants to know more about Word of Mouth Recommendation. Is Negative Word of Mouth (NWOM) more common than Positive Word Mouth?
a) Explain your answer, using examples. (5 marks)
b) Explain 4 triggers (internal or external) as to why someone would provide a word of mouth recommendation. Provide examples in relation to a local fruit and vegetable market, such as Schinella's Market. (5 marks)
Expert Answer:
The graph depicts the relationship between consumers intentions to buy and their actual usage of different brands Heres how we can interpret the positions of brands A B and C A Growing Brand This bran... View the full answer


Smith and Roberson Business Law
ISBN: 978-0538473637
15th Edition
Authors: Richard A. Mann, Barry S. Roberts
