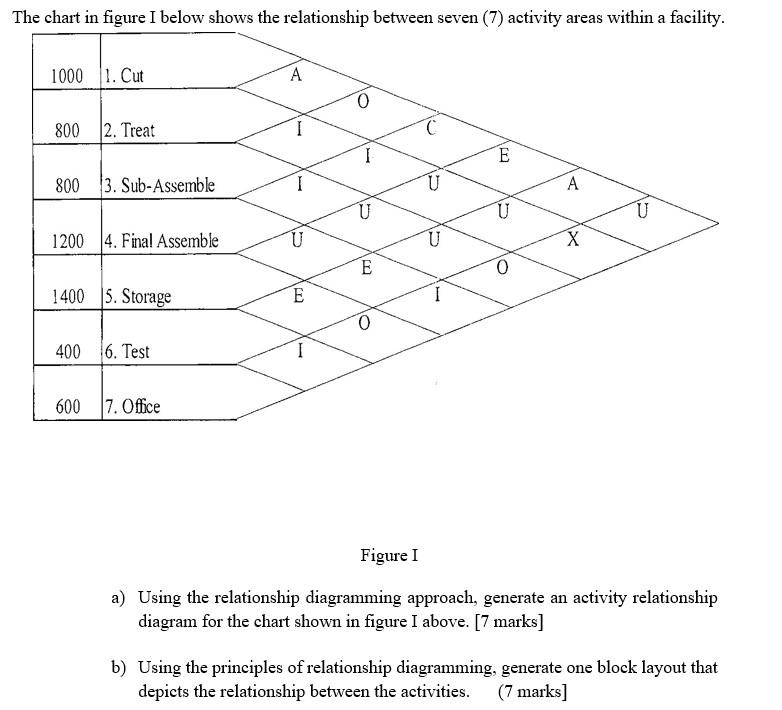
Question: The chart in figure I below shows the relationship between seven (7) activity areas within a facility. 1000 1. Cut A 0 800 2. Treat

The chart in figure I below shows the

The chart in figure I below shows the relationship between seven (7) activity areas within a facility. 1000 1. Cut A 0 800 2. Treat C E TV 800 3. Sub-Assemble U j A U U U 1200 4. Final Assemble U U X E 0 1400 15. Storage E 0 400 6. Test 600 7. Office Figure I a) Using the relationship diagramming approach, generate an activity relationship diagram for the chart shown in figure I above. [7 marks] b) Using the principles of relationship diagramming, generate one block layout that depicts the relationship between the activities. (7 marks]

Step by Step Solution

There are 3 Steps involved in it

1 Expert Approved Answer
Step: 1 Unlock blur-text-image
Question Has Been Solved by an Expert!

Get step-by-step solutions from verified subject matter experts

Step: 2 Unlock
Step: 3 Unlock

Students Have Also Explored These Related General Management Questions!