

Question: The chart shown in the image below has four data series plotted on two different vertical axes, one called LBS and the other called MILES.
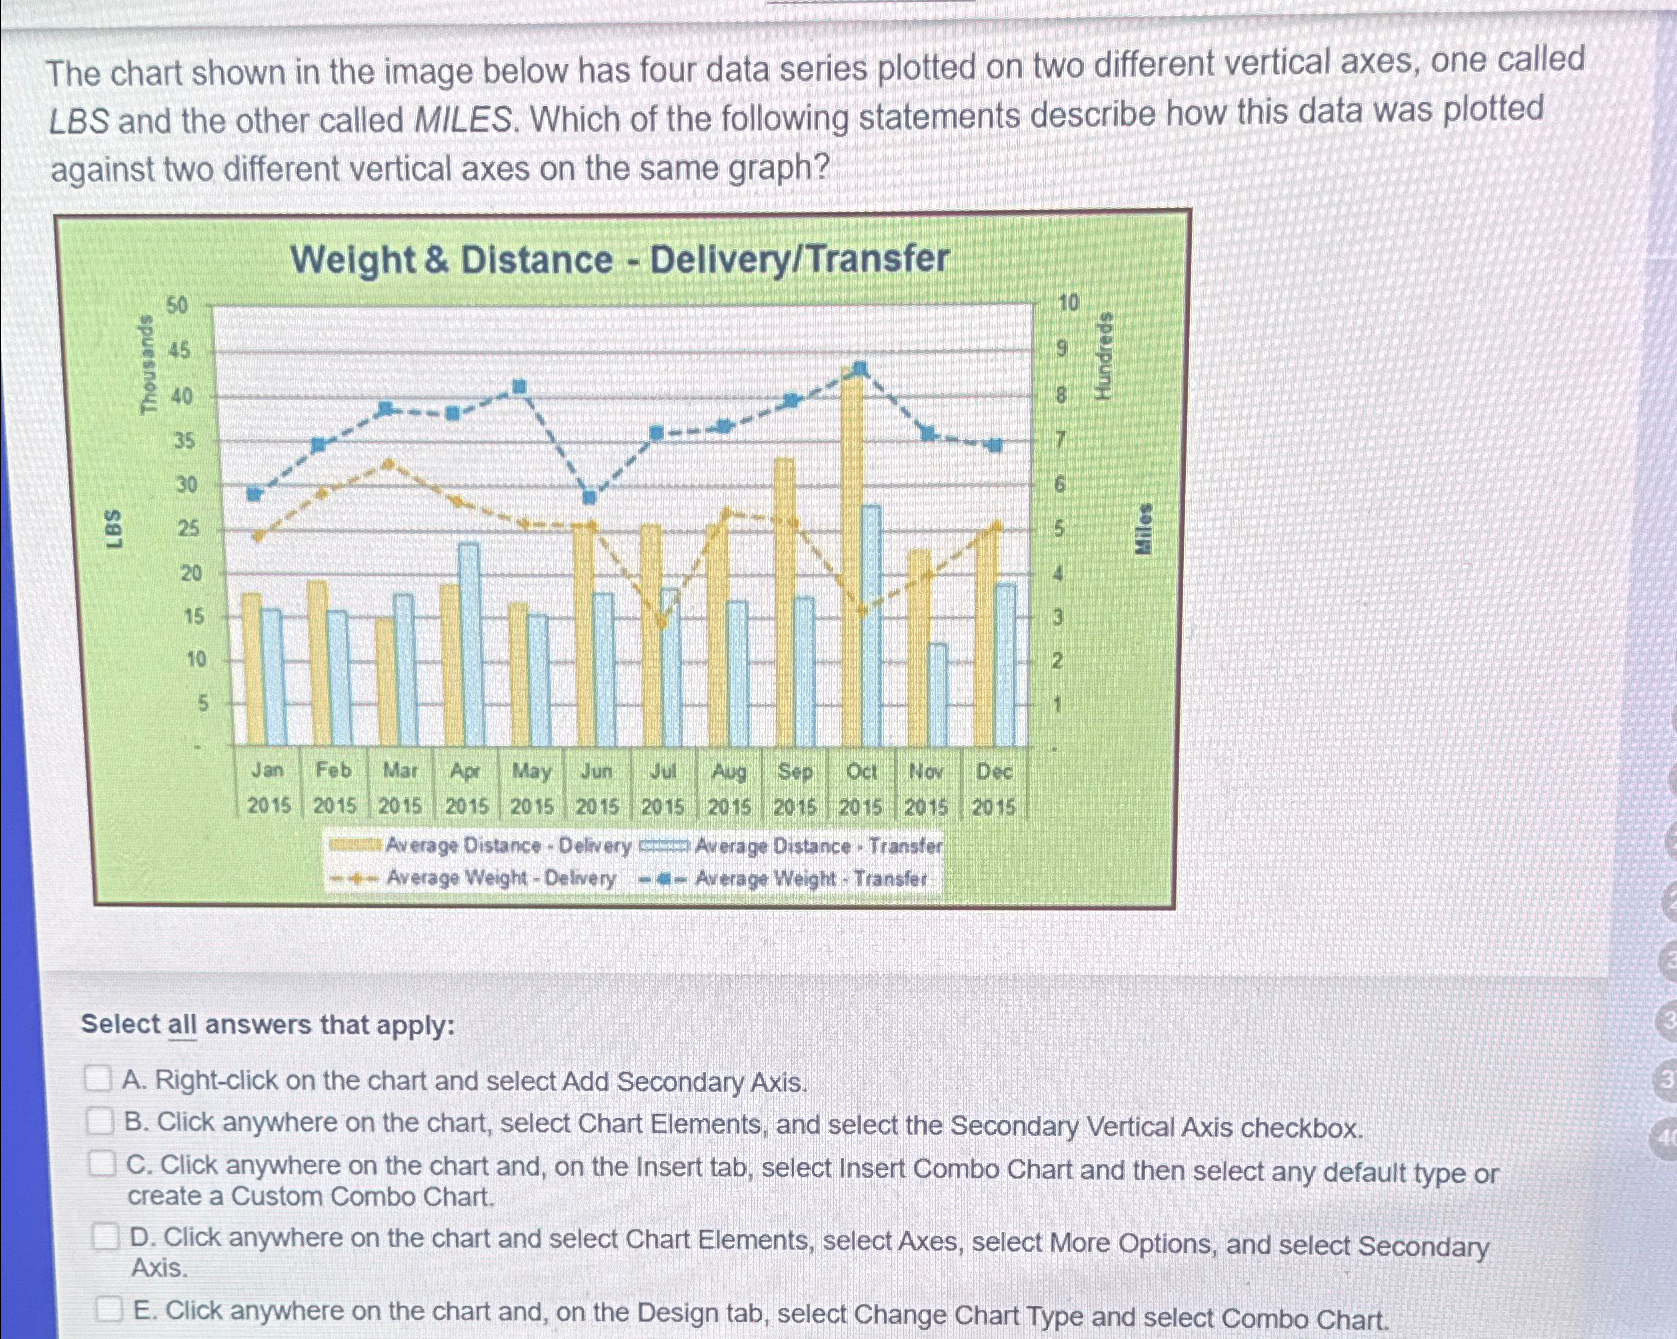
The chart shown in the image below has four data series plotted on two different vertical axes, one called LBS and the other called MILES. Which of the following statements describe how this data was plotted against two different vertical axes on the same graph?
Select all answers that apply:
A Rightclick on the chart and select Add Secondary Axis.
B Click anywhere on the chart, select Chart Elements, and select the Secondary Vertical Axis checkbox.
C Click anywhere on the chart and, on the Insert tab, select Insert Combo Chart and then select any default type or create a Custom Combo Chart.
D Click anywhere on the chart and select Chart Elements, select Axes, select More Options, and select Secondary Axis.
E Click anywhere on the chart and, on the Design tab, select Change Chart Type and select Combo Chart.
Step by Step Solution
There are 3 Steps involved in it
1 Expert Approved Answer
Step: 1 Unlock

Question Has Been Solved by an Expert!
Get step-by-step solutions from verified subject matter experts
Step: 2 Unlock
Step: 3 Unlock