Question: The Club is considering using predictive modeling to improve the efficacy of their direct marketing program. The Club sent 36,316 customers in PA, NY and
The Club is considering using predictive modeling to improve the efficacy of their direct marketing program.
The Club sent 36,316 customers in PA, NY and NJ a promotion for a new book. They obtained an 8.98% response rate (3263 orders). The Club has considered using a similar mail-in promotion tactic in the Midwest- in the Midwest there is data for 50,000 customers. The allocated cost of the mail-in promotion is $0.70 per addressee for this new book, and the book costs The Club $15 to purchase and mail. The selling price of the book is $19.95. We will assume that the distribution of the segments in the target (Midwest) market will mirror (be proportional to) the existing (tri-state) market and use the results from the existing market to make targeting decisions for the target market.
The two decision trees below are fairly different though they deal with the same data. The first tree is the Decision Model and the second is the Misclassification Model. Why might these differences have occurred? Do the differences make sense and Is one model better?
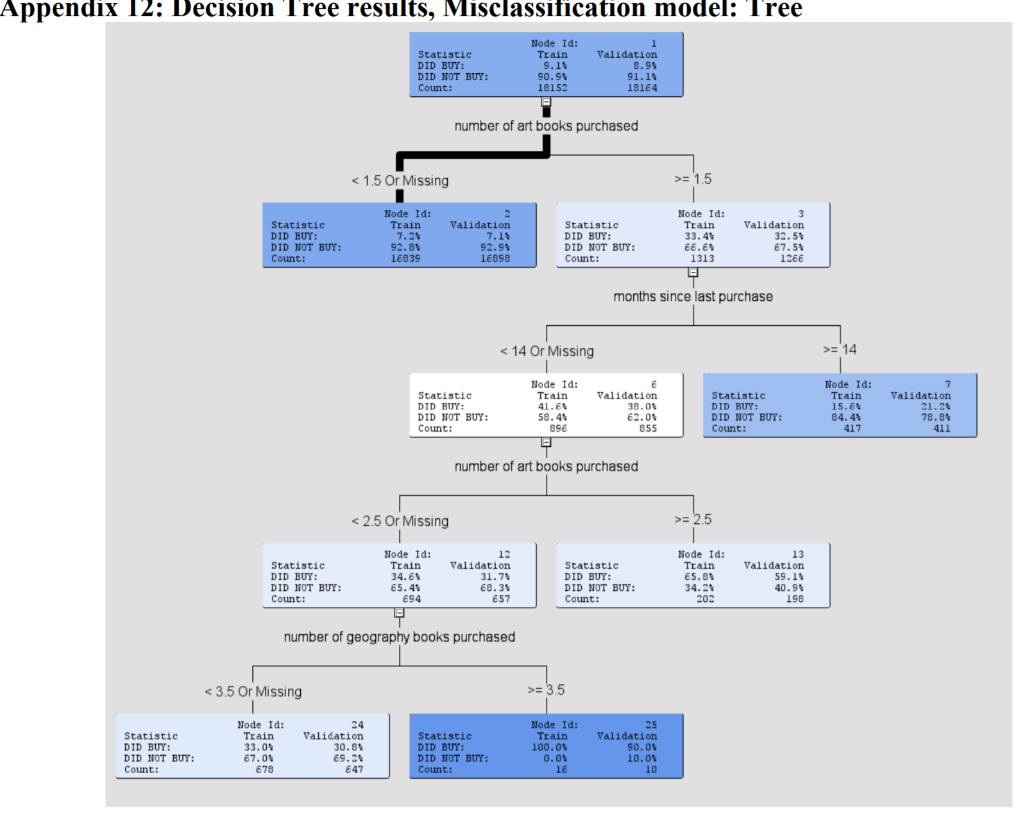
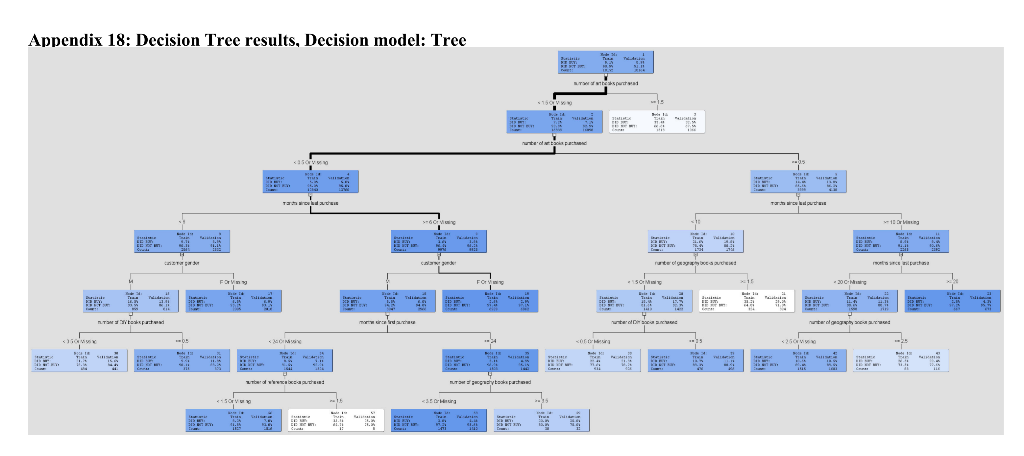
Appendix 12: Decision Tree results, Misclassification model: Tree Node Id: Train 1 Validation 9.11 8.95 Statistic DID BUY: DID NOT BUY: Count: 90.95 18152 91.15 18164 number of art books purchased = 1.5 Statistic DID BUY: DID NOT BUY: Count: Node Id: Train 7.2% 92.8$ 16839 Validation 7.19 92.95 16898 Node Id: 3 Statistic Train Validation DID BUY: 33.45 32.5% DID NOT BUY: 66.65 67.51 Count: 1313 1266 months since last purchase = 14 Statistic DID BUY: DID NOT BUY: Count: Node Id: Train 41.64 58.45 896 6 Validation 38.00 62.09 855 Statistic DID BUY: DID NOT BUY: Count: Node Id: Train 15.61 84.45 417 Validation 21.21 78.81 411 number of art books purchased = 2.5 Node Id: 12 Statistic Train Validation DID BUY: 34.61 31.71 DID NOT BUY: 65.41 68.35 Count: 694 657 number of geography books purchased Statistic DID BUY: DID NOT BUY: Count: Node Id: Train 65.81 34.25 202 13 Validation 59.15 40.99 198 = 3.5 Statistic DID BUY: DID NOT BUY: Count: Node Id: Train 33.05 67.00 678 24 Validation 30.88 69.24 647 Statistic DID BUY: DID NOT BUY: Count: Node Id: Train 100.00 0.01 16 25 Validation 90.05 10.08 10 Appendix 18: Decision Tree results, Decision model: Tree BTW WIN r -15V www.RU = 1.5 Statistic DID BUY: DID NOT BUY: Count: Node Id: Train 7.2% 92.8$ 16839 Validation 7.19 92.95 16898 Node Id: 3 Statistic Train Validation DID BUY: 33.45 32.5% DID NOT BUY: 66.65 67.51 Count: 1313 1266 months since last purchase = 14 Statistic DID BUY: DID NOT BUY: Count: Node Id: Train 41.64 58.45 896 6 Validation 38.00 62.09 855 Statistic DID BUY: DID NOT BUY: Count: Node Id: Train 15.61 84.45 417 Validation 21.21 78.81 411 number of art books purchased = 2.5 Node Id: 12 Statistic Train Validation DID BUY: 34.61 31.71 DID NOT BUY: 65.41 68.35 Count: 694 657 number of geography books purchased Statistic DID BUY: DID NOT BUY: Count: Node Id: Train 65.81 34.25 202 13 Validation 59.15 40.99 198 = 3.5 Statistic DID BUY: DID NOT BUY: Count: Node Id: Train 33.05 67.00 678 24 Validation 30.88 69.24 647 Statistic DID BUY: DID NOT BUY: Count: Node Id: Train 100.00 0.01 16 25 Validation 90.05 10.08 10 Appendix 18: Decision Tree results, Decision model: Tree BTW WIN r -15V www.RU


