

Question: The column chart is used to show q , comparisons trends or changes over a period of time interrelationships between large amounts of data relationships
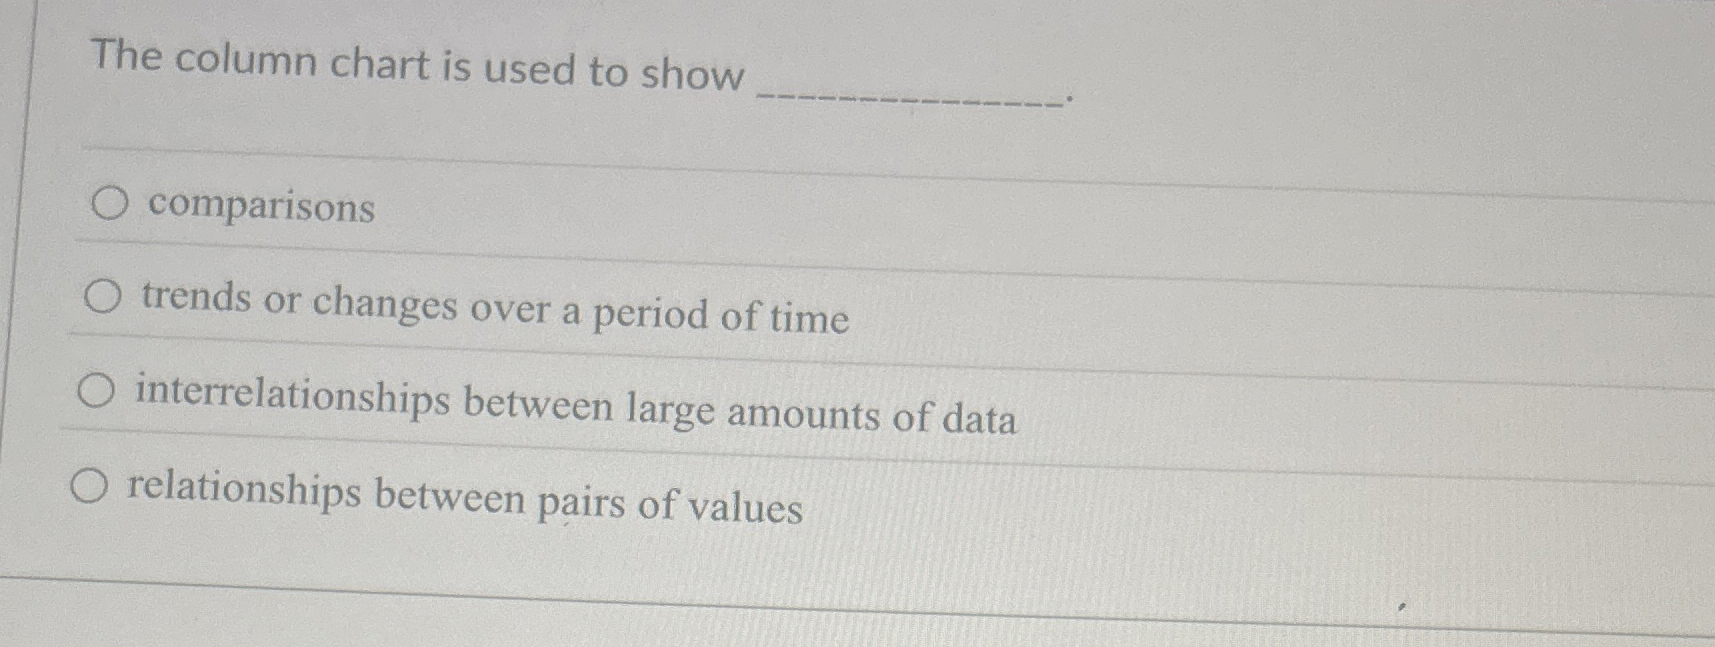
The column chart is used to show
comparisons
trends or changes over a period of time
interrelationships between large amounts of data
relationships between pairs of values
Step by Step Solution
There are 3 Steps involved in it
1 Expert Approved Answer
Step: 1 Unlock

Question Has Been Solved by an Expert!
Get step-by-step solutions from verified subject matter experts
Step: 2 Unlock
Step: 3 Unlock