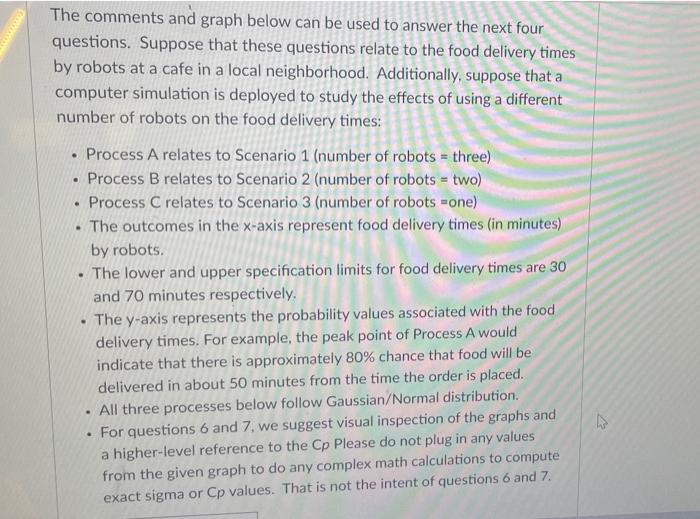
Question: The comments and graph below can be used to answer the next four questions. Suppose that these questions relate to the food delivery times by

The comments and graph below can be used to
The comments and graph below can be used to answer the next four questions. Suppose that these questions relate to the food delivery times by robots at a cafe in a local neighborhood. Additionally, suppose that a computer simulation is deployed to study the effects of using a different number of robots on the food delivery times: Process A relates to Scenario 1 (number of robots = three) . Process B relates to Scenario 2 (number of robots = two) . Process C relates to Scenario 3 (number of robots =one) . The outcomes in the x-axis represent food delivery times (in minutes) by robots. . The lower and upper specification limits for food delivery times are 30 and 70 minutes respectively. . The y-axis represents the probability values associated with the food delivery times. For example, the peak point of Process A would indicate that there is approximately 80% chance that food will be delivered in about 50 minutes from the time the order is placed. . . All three processes below follow Gaussian/Normal distribution. For questions 6 and 7, we suggest visual inspection of the graphs and a higher-level reference to the Cp Please do not plug in any values from the given graph to do any complex math calculations to compute exact sigma or Cp values. That is not the intent of questions 6 and 7. k With reference to inspecting if the food delivery times are within an acceptable range specified by customers, Scenario 1 is expected to have a lower appraisal cost than Scenario 2. O True False With reference to the food delivery times, since the control limits are: inside the range of the spec. limits in Scenario 1, and outside the range of spec. limits in Scenario 2, we would expect a good quality manager trained in TQM principles to rate Scenario 1 to be better than Scenario 2. O True O False Identify the true statement. O a. Processes associated with Scenario 1 and 2 seem to have similar variation and hence, similar sigma (o) values. O b. Processes associated with Scenario 1 and 3 seem to have similar variation and hence, similar sigma (o) values. O c. Processes associated with Scenario 2 and 3 seem to have similar variation and hence, similar sigma (o) values.. O d. Choices a and b are both true. Choose the correct statement. Similar to the other questions in this quiz, there is only one correct answer. O a. Processes associated with Scenario 1 and 2 are likely to have similar Cp values. O b. Processes associated with Scenario 1 and 3 are likely to have similar Cp values. O c. Processes associated with Scenario 2 and 3 are likely to have similar Cp values

Step by Step Solution

There are 3 Steps involved in it

1 Expert Approved Answer
Step: 1 Unlock blur-text-image
Question Has Been Solved by an Expert!

Get step-by-step solutions from verified subject matter experts

Step: 2 Unlock
Step: 3 Unlock

Students Have Also Explored These Related General Management Questions!