

Question: The company has decided they needed to create a full set of budget schedules including financial statements for the first year of operations based on
-
The company has decided they needed to create a full set of budget schedules including financial statements for the first year of operations based on an assumption of constant demand of 18,000 quarterly and 72,000 for the first year (appendices B-1 through B-11). A second set of budget schedules and financial statements based on expected unit sales of 15,000 in quarter one, 25,000 in quarter two, 20,000 in quarter three, and finally 12,000 in quarter four for a total of 72,000 for the year based on a seasonal demand pattern (appendices C-1 through C-11). We expect the same quarterly sales patterns in year two meaning 18,000 units per quarter under constant demand and 15,000 units in quarter one under seasonal demand.
*Compare the constant demand to the seasonal demand budget.
*Explain the major differences in each of the budget schedules, cash budget and financial statements on both a quarterly and annual basis. Remember the beginning and ending raw material and finished goods inventory units will cause differences in the budgets but also focus on the differences between accrual and cash timing figures.
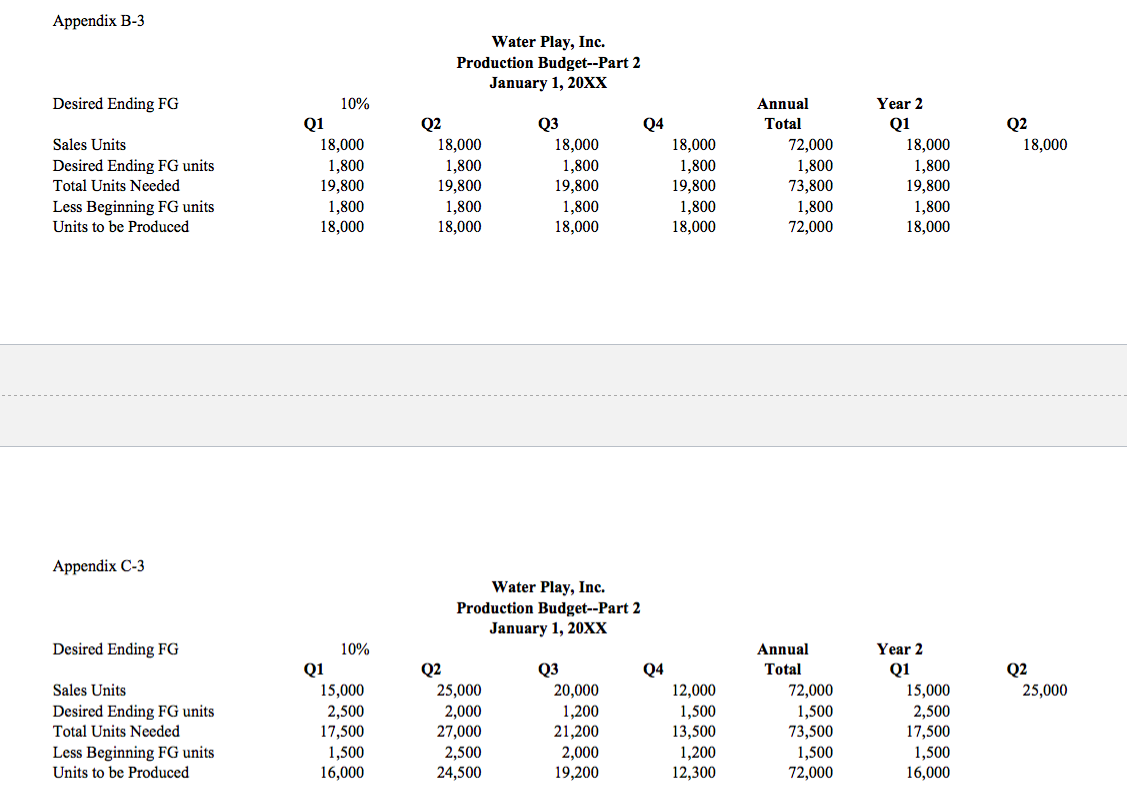
Appendix B-3 Water Play, Inc. Production Budget--Part 2 January 1, 20XX Desired Ending FG Q2 18,000 Sales Units Desired Ending FG units Total Units Needed Less Beginning FG units Units to be produced 10% Q1 18,000 1,800 19,800 1,800 18,000 Q2 18,000 1,800 19,800 1,800 18,000 Q3 18,000 1,800 19,800 1,800 18,000 Q4 18,000 1,800 19,800 1,800 18,000 Annual Total 72,000 1,800 73,800 1,800 72,000 Year 2 Q1 18,000 1,800 19,800 1,800 18,000 Appendix C-3 Water Play, Inc. Production Budget--Part 2 January 1, 20XX Desired Ending FG Q4 Q2 25,000 Sales Units Desired Ending FG units Total Units Needed Less Beginning FG units Units to be Produced 10% Q1 15,000 2,500 17,500 1,500 16,000 Q2 25,000 2,000 27,000 2,500 24,500 Q3 20,000 1,200 21,200 2,000 19,200 12,000 1,500 13,500 1,200 12,300 Annual Total 72,000 1,500 73,500 1,500 72,000 Year 2 Q1 15,000 2,500 17,500 1,500 16,000 Appendix B-3 Water Play, Inc. Production Budget--Part 2 January 1, 20XX Desired Ending FG Q2 18,000 Sales Units Desired Ending FG units Total Units Needed Less Beginning FG units Units to be produced 10% Q1 18,000 1,800 19,800 1,800 18,000 Q2 18,000 1,800 19,800 1,800 18,000 Q3 18,000 1,800 19,800 1,800 18,000 Q4 18,000 1,800 19,800 1,800 18,000 Annual Total 72,000 1,800 73,800 1,800 72,000 Year 2 Q1 18,000 1,800 19,800 1,800 18,000 Appendix C-3 Water Play, Inc. Production Budget--Part 2 January 1, 20XX Desired Ending FG Q4 Q2 25,000 Sales Units Desired Ending FG units Total Units Needed Less Beginning FG units Units to be Produced 10% Q1 15,000 2,500 17,500 1,500 16,000 Q2 25,000 2,000 27,000 2,500 24,500 Q3 20,000 1,200 21,200 2,000 19,200 12,000 1,500 13,500 1,200 12,300 Annual Total 72,000 1,500 73,500 1,500 72,000 Year 2 Q1 15,000 2,500 17,500 1,500 16,000
Step by Step Solution
There are 3 Steps involved in it

Get step-by-step solutions from verified subject matter experts