

Question: The company tested six training programs to determine which was the most effective. Employees were selected at random without replacement to participate in one of
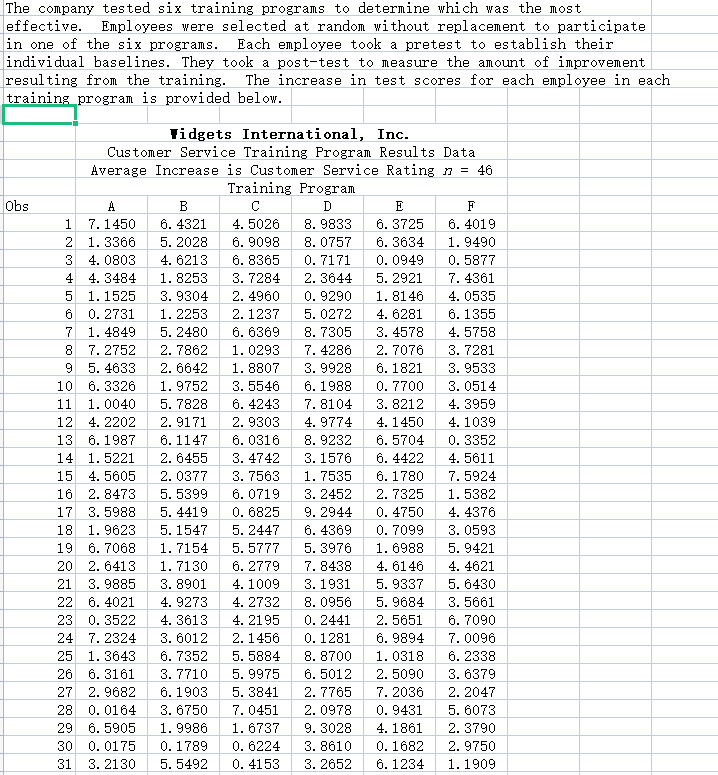


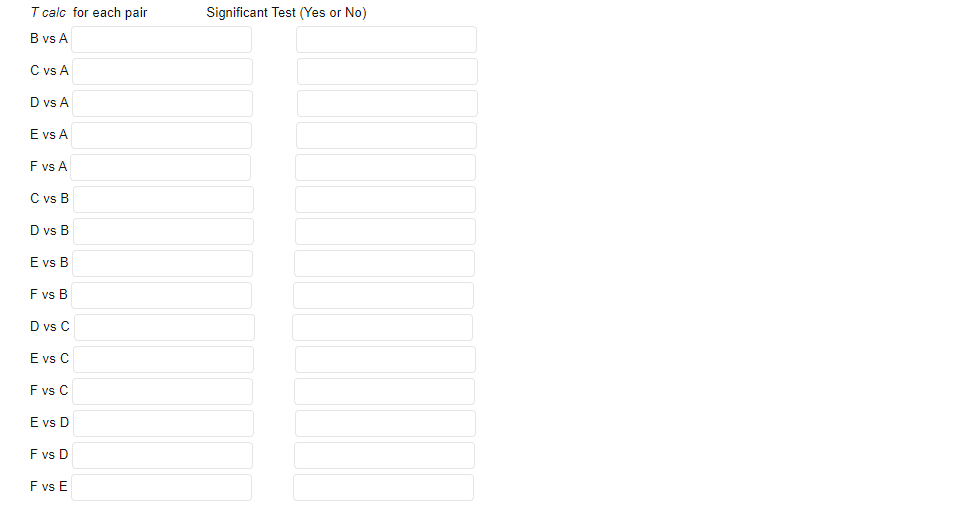

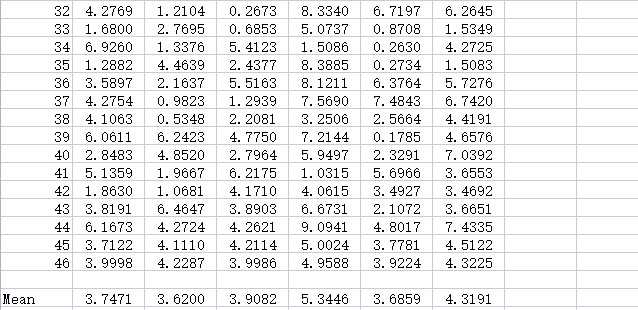
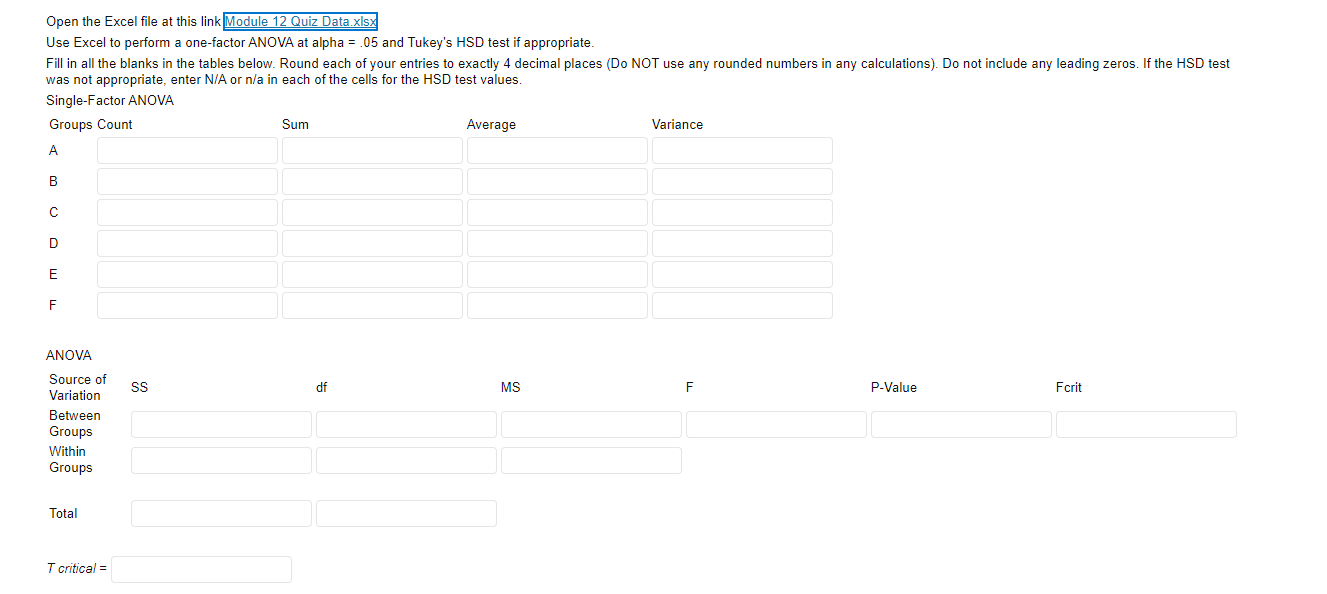

The company tested six training programs to determine which was the most effective. Employees were selected at random without replacement to participate in one of the six programs. Each employee took a pretest to establish their individual baselines. They took a post-test to measure the amount of improvement resulting from the training. The increase in test scores for each employee in each training program is provided below. Widgets International, Inc. Customer Service Training Program Results Data Average Increase is Customer Service Rating 13 = 46 Training Program Obs A B C D E F 1 7. 1450 6. 4321 4. 5026 8. 9833 6. 3725 6. 4019 2 1. 3366 5. 2028 6. 9098 8. 0757 6. 3634 1. 9490 3 4. 0803 4. 6213 6. 8365 0. 7171 0. 0949 0. 5877 4 4. 3484 1. 8253 3. 7284 2. 3644 5. 2921 7. 4361 5 1. 1525 3. 9304 2. 4960 0. 9290 1. 8146 4. 0535 6 0. 2731 1. 2253 2. 1237 5. 0272 4. 6281 6. 1355 7 1. 4849 5. 2480 6. 6369 8. 7305 3. 4578 4. 5758 7. 2752 2. 7862 1. 0293 7. 4286 2. 7076 3. 7281 5. 4633 2. 6642 1. 8807 3. 9928 6. 1821 3. 9533 10 6. 3326 1. 9752 3. 5546 6. 1988 0. 7700 3. 0514 11 1. 0040 5. 7828 6. 4243 7. 8104 3. 8212 4. 3959 12 4. 2202 2. 9171 2. 9303 4. 9774 4. 1450 4. 1039 13 6. 1987 6. 1147 6. 0316 8. 9232 6. 5704 0. 3352 14 1. 5221 2. 6455 3. 4742 3. 1576 6. 4422 4. 5611 15 4. 5605 2. 0377 3. 7563 1. 7535 6. 1780 7. 5924 16 2. 8473 5. 5399 6. 0719 3. 2452 2. 7325 1. 5382 17 3. 5988 5. 4419 0. 6825 9. 2944 0. 4750 4. 4376 18 1. 9623 5. 1547 5. 2447 6. 4369 0. 7099 3. 0593 19 6. 7068 1. 7154 5. 5777 5. 3976 1. 6988 5. 9421 20 2. 6413 1. 7130 6. 2779 7. 8438 4. 6146 4. 4621 21 3. 9885 3. 8901 4. 1009 3. 1931 5. 9337 5. 6430 22 6. 4021 4. 9273 4. 2732 8. 0956 5. 9684 3. 5661 23 0. 3522 4. 3613 4. 2195 0. 2441 2. 5651 6. 7090 24 7. 2324 3. 6012 2. 1456 0. 1281 6. 9894 7. 0096 25 1. 3643 6. 7352 5. 5884 8. 8700 1. 0318 6. 2338 26 6. 3161 3. 7710 5. 9975 6. 5012 2. 5090 3. 6379 27 2. 9682 6. 1903 6. 3841 2. 7765 7. 2036 2. 2047 28 0. 0164 3. 6750 7. 0451 2. 0978 0. 9431 5. 6073 29 6. 5905 1. 9986 1. 6737 9. 3028 4. 1861 2. 3790 30 0. 0175 0. 1789 0. 6224 3. 8610 0. 1682 2. 9750 31 3. 2130 5. 5492 0. 4153 3. 2652 6. 1234 1. 1909\fOpen the Excel file at this link Module 12 Quiz Data.xIsx Use Excel to perform a one-factor ANOVA at alpha = .05 and Tukey's HSD test if appropriate. Fill in all the blanks in the tables below. Round each of your entries to exactly 4 decimal places (Do NOT use any rounded numbers in any calculations). Do not include any leading zeros. If the HSD test was not appropriate, enter N/A or n/a in each of the cells for the HSD test values. Single-Factor ANOVA Groups Count Sum Average Variance A B C E ANOVA Source of SS df MS F P-Value Fcrit Variation Between Groups Within Groups Total T critical =T calc for each pair Significant Test (Yes or No) B VS A C VS A D VS A E VS A F VS A C vs B D vs B E vs B F vs B D vs C Evs C F vs C E vs D F vs D F vs E
Step by Step Solution
There are 3 Steps involved in it

Get step-by-step solutions from verified subject matter experts