

Question: The control charts ( x-bar and R ) are tools to visualize which aspect of the process? If the output from the process is within
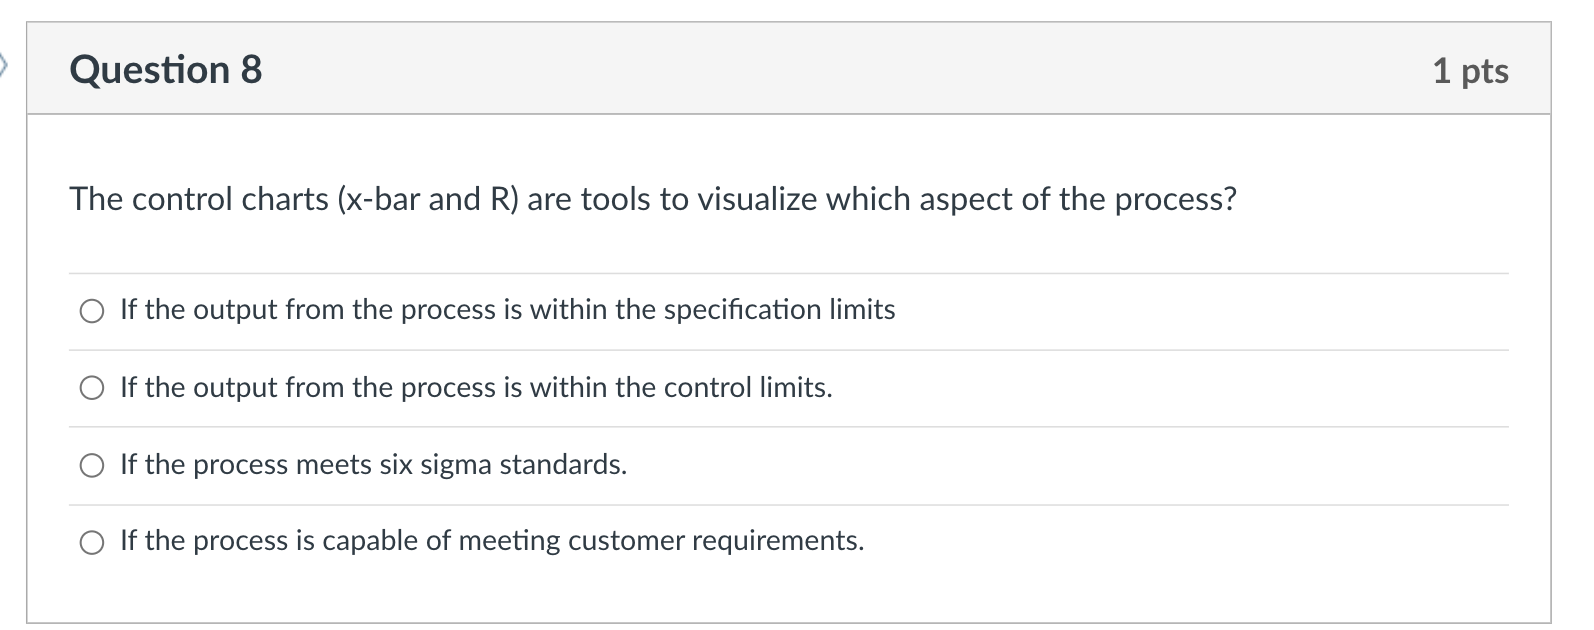
The control charts ( x-bar and R ) are tools to visualize which aspect of the process? If the output from the process is within the specification limits If the output from the process is within the control limits. If the process meets six sigma standards. If the process is capable of meeting customer requirements
Step by Step Solution
There are 3 Steps involved in it
1 Expert Approved Answer
Step: 1 Unlock

Question Has Been Solved by an Expert!
Get step-by-step solutions from verified subject matter experts
Step: 2 Unlock
Step: 3 Unlock