

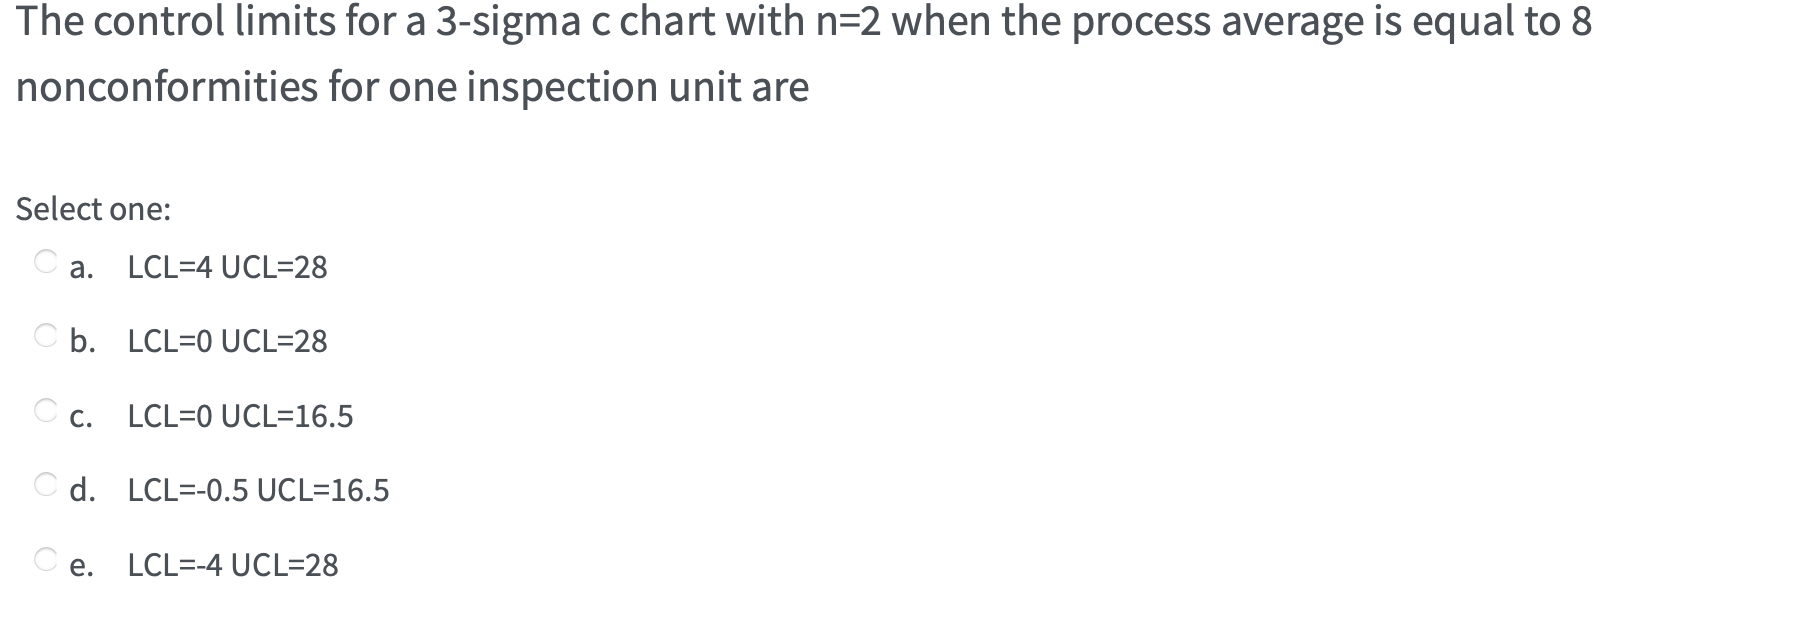
Question: The control limits for a 3-sigma c chart with n=2 when the process average is equal to 8 nonconformities for one inspection unit are Select
Step by Step Solution
There are 3 Steps involved in it
1 Expert Approved Answer
Step: 1 Unlock

Question Has Been Solved by an Expert!
Get step-by-step solutions from verified subject matter experts
Step: 2 Unlock
Step: 3 Unlock