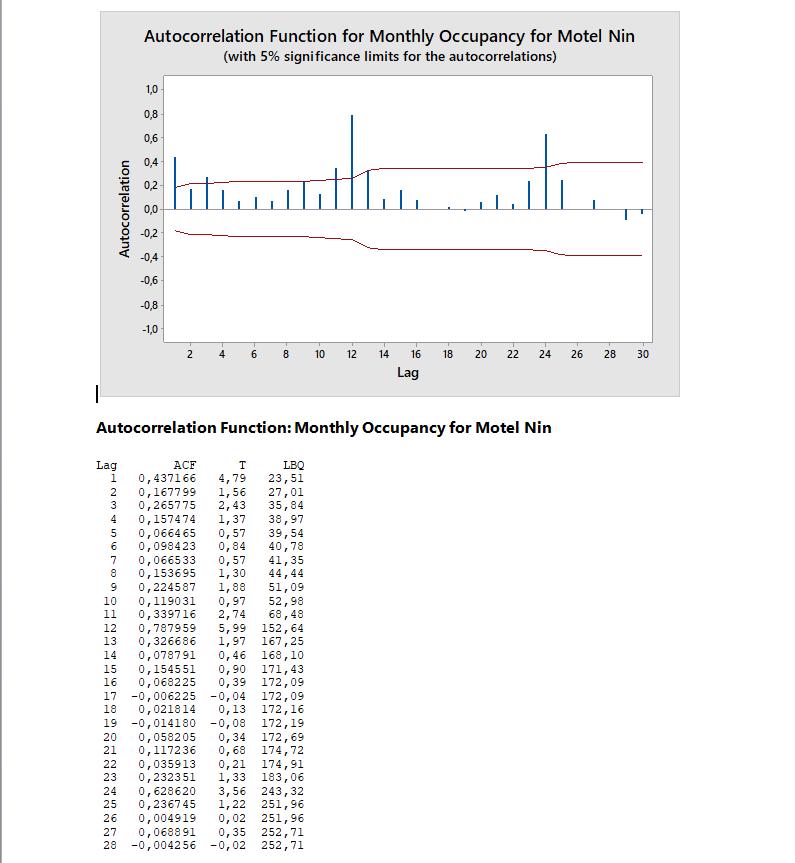
The correlogram and related statistics for a time series are included in the attached file. Use...
Fantastic news! We've Found the answer you've been seeking!
Question:
Transcribed Image Text:
The correlogram and related statistics for a time series are included in the attached file. Use these graphical and numerical figures to answer the following questions. a. Test whether the individual autocorrelations for time lag 1 and time lag 12 are significantly different from zero at the 0.05 significance level. (Write down the relevant hypotheses and show all steps of the testing process) b. Test the first five sample autocorrelations as a group for this times series at the 0.05 significance level.(Write down the relevant hypothesis and show all steps of the testing process) c. Summarize what the correlogram and corresponding statistics tell you about the series. Lag 1 2 3 LASA W 4 NNNNNNN 5 6 Autocorrelation Function: Monthly Occupancy for Motel Nin Autocorrelation 7 8 90T23 10 11 12 13 14 15 16 17 18 34 25 1607 Autocorrelation Function for Monthly Occupancy for Motel Nin (with 5% significance limits for the autocorrelations) 26 1,0 0,8 0,6 0,4 0,2 0,0 -0,2 -0,4 -0,6 -0,8 -1,0 0,224587 1,88 51,09 0,119031 0,97 52,98 0,339716 2,74 68,48 0,787959 5,99 152,64 0,326686 1,97 167,25 0,078791 0,46 168,10 0,154551 0,90 171,43 0,068225 0,39 172,09 -0,006225 -0,04 172,09 0,021814 0,13 172,16 19 -0,014180 -0,08 172,19 20 0,058205 0,34 172,69 21 0,117236 0,68 174,72 22 0,035913 0,21 174,91 23 0,232351 1,33 183,06 24 0,628620 3,56 243,32 0,236745 1,22 251,96 0,004919 0,02 251,96 27 0,068891 0,35 252,71 28 -0,004256 -0,02 252,71 2 + 50 8 ACF Т LBQ 0,437166 4,79 23,51 0,167799 1,56 27,01 0,265775 2,43 35,84 0,157474 1,37 38,97 0,066465 0,57 39,54 0,098423 0,84 40,78 0,066533 0,57 41,35 0,153695 1,30 44,44 10 12 14 16 18 20 22 24 26 Lag 28 30 The correlogram and related statistics for a time series are included in the attached file. Use these graphical and numerical figures to answer the following questions. a. Test whether the individual autocorrelations for time lag 1 and time lag 12 are significantly different from zero at the 0.05 significance level. (Write down the relevant hypotheses and show all steps of the testing process) b. Test the first five sample autocorrelations as a group for this times series at the 0.05 significance level.(Write down the relevant hypothesis and show all steps of the testing process) c. Summarize what the correlogram and corresponding statistics tell you about the series. Lag 1 2 3 LASA W 4 NNNNNNN 5 6 Autocorrelation Function: Monthly Occupancy for Motel Nin Autocorrelation 7 8 90T23 10 11 12 13 14 15 16 17 18 34 25 1607 Autocorrelation Function for Monthly Occupancy for Motel Nin (with 5% significance limits for the autocorrelations) 26 1,0 0,8 0,6 0,4 0,2 0,0 -0,2 -0,4 -0,6 -0,8 -1,0 0,224587 1,88 51,09 0,119031 0,97 52,98 0,339716 2,74 68,48 0,787959 5,99 152,64 0,326686 1,97 167,25 0,078791 0,46 168,10 0,154551 0,90 171,43 0,068225 0,39 172,09 -0,006225 -0,04 172,09 0,021814 0,13 172,16 19 -0,014180 -0,08 172,19 20 0,058205 0,34 172,69 21 0,117236 0,68 174,72 22 0,035913 0,21 174,91 23 0,232351 1,33 183,06 24 0,628620 3,56 243,32 0,236745 1,22 251,96 0,004919 0,02 251,96 27 0,068891 0,35 252,71 28 -0,004256 -0,02 252,71 2 + 50 8 ACF Т LBQ 0,437166 4,79 23,51 0,167799 1,56 27,01 0,265775 2,43 35,84 0,157474 1,37 38,97 0,066465 0,57 39,54 0,098423 0,84 40,78 0,066533 0,57 41,35 0,153695 1,30 44,44 10 12 14 16 18 20 22 24 26 Lag 28 30
Expert Answer:
Answer rating: 100% (QA)
a Testing individual autocorrelations at lag 1 and lag 12 To test whether the individual autocorrelations at time lags 1 and 12 are significantly different from zero at the 005 significance level you ... View the full answer
Related Book For
Posted Date:
Students also viewed these accounting questions
-
Use the diagram to answer the following questions (ad). a. At the equilibrium price before the tax is imposed, what area represents consumer surplus? What area represents producer surplus? b. Say...
-
Use the MundellFleming model to answer the following questions about the province of Alberta (a small open economy). a. What kind of exchange-rate system does Alberta have with its major trading...
-
Use Figure 4.5 to answer the following questions about the acid-catalyzed hydration of an alkene: a. How many transition states are there? b. How many intermediates are there? c. Which is more...
-
According to the 1980 revisions to the Copyright Act of 1976,_____. a. the owner of a copyrighted program is allowed to make multiplecopies or adaptations for use on other computers b. copyright...
-
A company takes out a four-year, $800,000 mortgage on May 1. The interest rate on the loan is 5% per year, and blended payments of $18,423 (including both interest and principal) are to be made at...
-
Suggest how Nike can successfully deal with the protests against it.
-
In an earlier SIOP salary survey (Katkowski \& Medsker, 2001), 73 of the respondents ( 33 males, 40 females) received their master's degrees in the 10 -year period from 1991 to 2000. Listed below are...
-
Fantastique Bikes is a company that manufactures bikes in a monopolistically competitive market. The following graph shows Fantastique?s demand curve, marginal revenue curve (MR), marginal cost curve...
-
You have already learned that when preparing financial statements, management makes assertions about each account and the relate disclosures in the notes. Auditors then gather sufficient appropriate...
-
The cash book (bank columns) of Ella for the month of May 207 were as follows: Ellas bank statement for May 207 showed the following: The following errors were discovered: 1. Ella had overcast the...
-
Part of Glo's strategic plan is to capture market segments that are traditionally underserved. Glo's management believes that the market for men's care products is underserved and would be an...
-
Can you elucidate the role of ideology critique within Critical Theory, particularly in examining how dominant ideologies shape social norms, values, and beliefs, and perpetuate systems of inequality?
-
The total of the figures on the left side of an Accounts Payable account is $35,800. The total of the figures on the right side is $15,100. The balance of this account A.is $50,900 and would be...
-
= Let Yi (Y1,..., YiT)" and {Y} be an i.i.d. sample. Further suppose that Yit = A + B + Vit with E [Vit] =0 and where we treat A, and Bt as parameters to be estimated. Let D; be as in (4.36) and...
-
A proposed wind farm installation is based on the use of fourteen 2.5 MW wind turbines. The installed capital cost is estimated at $1100/kW & the annual operation & maintenance costs are estimated to...
-
Suppose that last year, the market price for a certain bond was $ 1 0 , 9 5 7 . Since then, the price has decreased by 1 0 . 9 % . If the current yield was 6 % last year, what is the current yield...
-
An iron object weighs 10 N in air. How much does it weigh in water. (Iron density is 7.86 10 kg/m). Use g=9.81 ms-.
-
How is use of the word consistent helpful in fraud reports?
-
Use consumer and producer surplus to show the deadweight loss from a subsidy (producing more than the equilibrium output).
-
Suppose the following data represent points along a short-run Phillips curve. Are the data consistent with what you would expect? Why or whynot? Inflation Rate 0% 1% 2% 3% 4% Unemployment Rate 5%...
-
True or False: 1. The expenditure multiplier applies to any increase in autonomous expenditures. 2. An increase of $10 million in autonomous consumption has the same effect on output as a $10 million...
-
Consider the following time series data. a. Construct a time series plot. What type of pattern exists in the data? b. Show the four-quarter and centered moving average values for this time series. c....
-
Refer to exercise 35. a. Deseasonalize the time series using the adjusted seasonal indexes computed in part (c) of exercise 35. b. Using Minitab or Excel, compute the linear trend regression equation...
-
The following table reports prices and usage quantities for two items in 2009 and 2011. a. Compute price relatives for each item in 2011 using 2009 as the base period. b. Compute an unweighted...
Study smarter with the SolutionInn App