

Question: The crosstabulation table below reports results from a different March 2020 Gallup Poll survey. It compares the distribution of responses to a question about how
The crosstabulation table below reports results from a different March 2020 Gallup Poll survey. It compares the distribution of responses to a question about how worried the respondent is about being exposed to the coronavirus across a 3-category measure of partisanship. Use the crosstabulation to answer the following two questions.
a) According to the crosstabulation, how does the level of concern about being exposed to Covid-19 differ across respondents based on their partisanship? Explain your answer.
b) Test the null hypothesis that a respondent's level of concern about being exposed to Covid-19 is statistically independent of their partisanship. Can you reject this null hypothesis at the 5% significance level? What about at the 1% significance level?
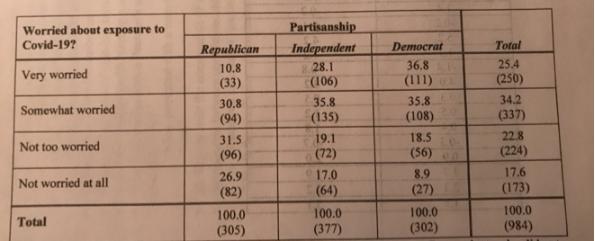
Worried about exposure to Covid-197 Very worried Somewhat worried Not too worried Not worried at all Total Republican 10.8 (33) 30.8 (94) 31.5 (96) 26.9 (82) 100.0 (305) Partisanship Independent 28.1 (106) 35.8 (135) 19.1 (72) 17.0 (64) 100.0 (377) Democrat 36.8 (111) 35.8 (108) 18.5 (56) 8.9 (27) 100.0 (302) Total 25.4 (250) 34.2 (337) 22.8 (224) 17.6 (173) 100.0 (984)
Step by Step Solution
3.46 Rating (149 Votes )
There are 3 Steps involved in it

Get step-by-step solutions from verified subject matter experts