

Question: The cumulative frequency polygon below represents the sample data provided above. Use the cumulative frequency polygon to estimate the interquartile range. A. The interquartile range
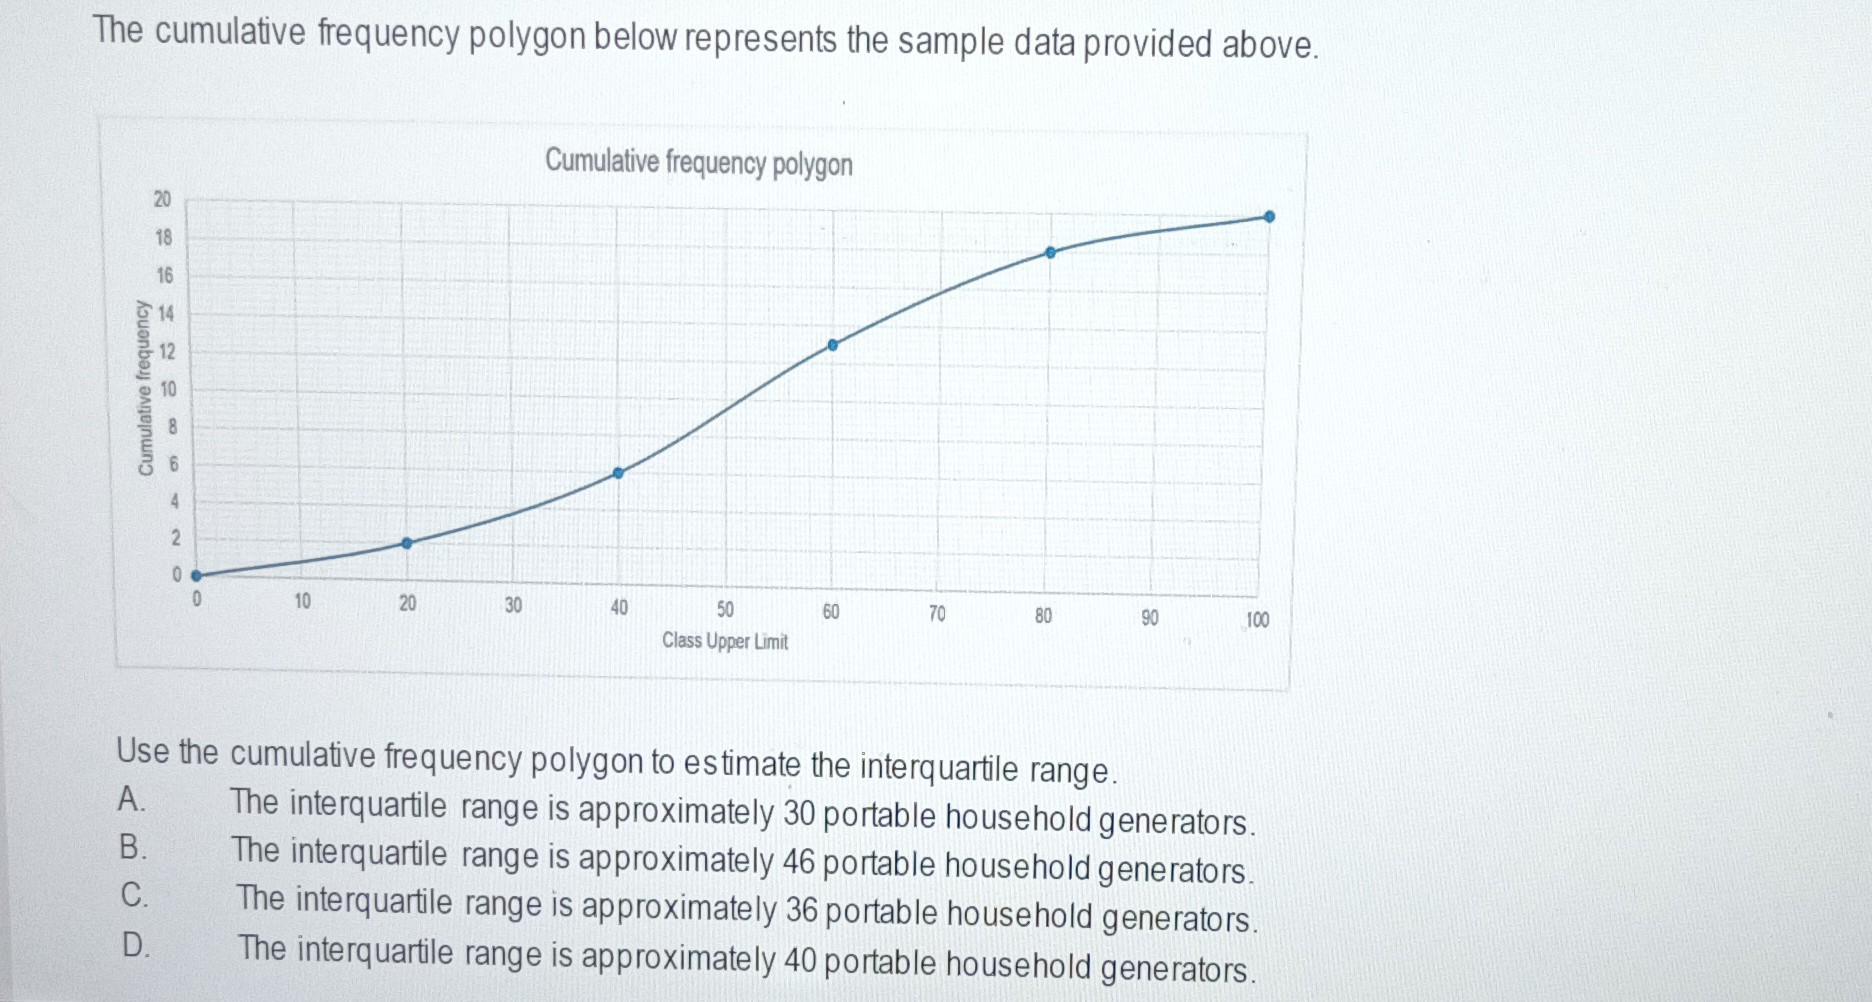
The cumulative frequency polygon below represents the sample data provided above. Use the cumulative frequency polygon to estimate the interquartile range. A. The interquartile range is approximately 30 portable household generators. B. The interquartile range is approximately 46 portable household generators. C. The interquartile range is approximately 36 portable household generators D. The interquartile range is approximately 40 portable household generators
Step by Step Solution
There are 3 Steps involved in it
1 Expert Approved Answer
Step: 1 Unlock

Question Has Been Solved by an Expert!
Get step-by-step solutions from verified subject matter experts
Step: 2 Unlock
Step: 3 Unlock