

Question: The Data: (40) De Anza students were asked how many movies (at the movie theatre) they saw in March. The data is summarized in the
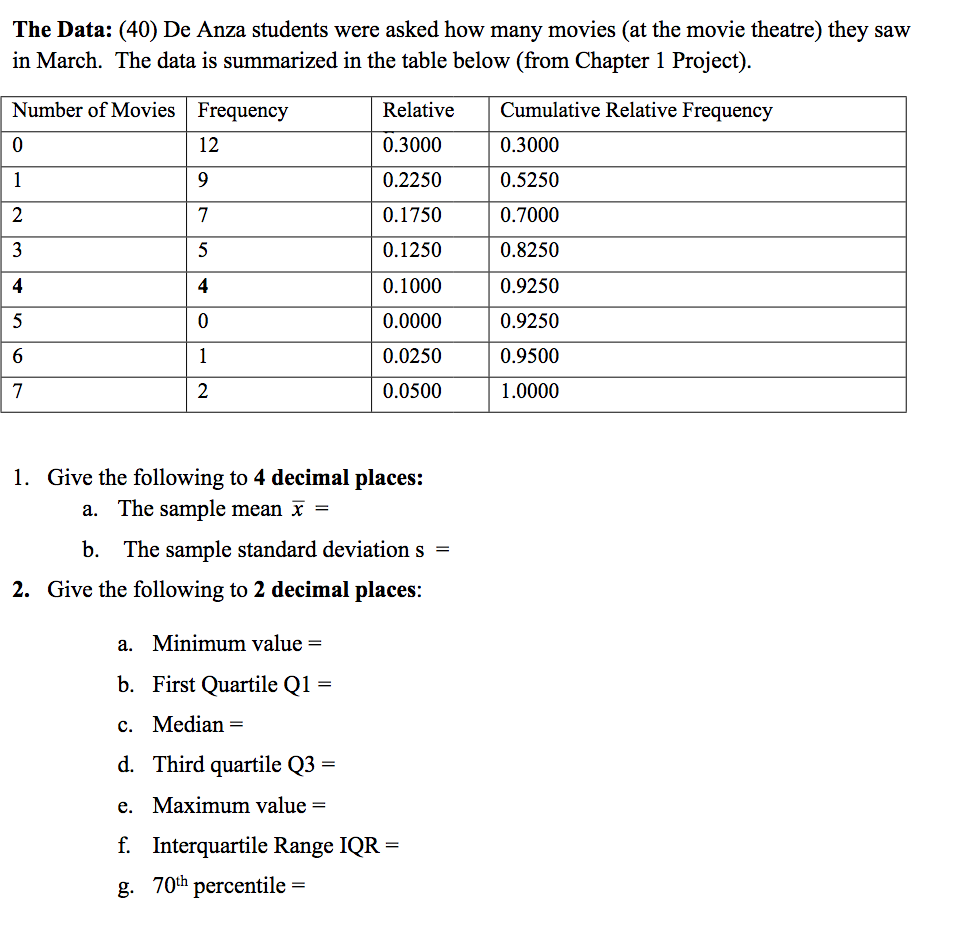
The Data: (40) De Anza students were asked how many movies (at the movie theatre) they saw in March. The data is summarized in the table below (om Chapter 1 Project). Number of Movies Relative Cumulative Relative Frequency 0.3000 0.3000 0.2250 0.5250 0.1750 0.7000 0.1250 0.8250 0.1000 0.9250 0.0000 0.9250 0.0250 0.9500 0.0500 1.0000 G H M mm GNU] 9 7 5 4 4 0 1 2 a] I. Give the following to 4 decimal places: a. The sample mean i = b. The sample standard deviation 5 = 2. Give the following to 2 decimal places: Minimum value = First Quartile Q1 = 6 Median = (1. Third quartile Q3 = F" 9\" Maximum value = Interquartile Range IQR = 5" '."'J g. 70* percentile = . Are there any potential outliers? Which value(s) is (are) it (they)? Use a formula (show work!) to check the end values to determine if they are potential outliers. . Using the sample statistics, show your work to nd the number that is 1.8 standard deviations below the mean. (Show work and give answer to 4 decimal places) . Are the data discrete or continuous? How do you know? Give your answer as a complete sentence. . Fill in the blanks (HINT: IQR) The middle 50% of the students saw between and movies at the movie theatre in March. . What does the 1'0lh percentile represent in this problem? (This means interpret the 1'0th percentile.) Give your answer as a complete sentence. Your answer should include the words \"students" and \"movies\9. Construct a hex plot of data. Sketch the graph using a ruler and pencil, or computer. Scale and label the (ONE) axis. Be sure to turn this in. The box plot may be drawn here or on a separate page
Step by Step Solution
There are 3 Steps involved in it

Get step-by-step solutions from verified subject matter experts