

Question: The data below are the batting averages for every team in the American League at about midseason in 1999. # of times at bat that
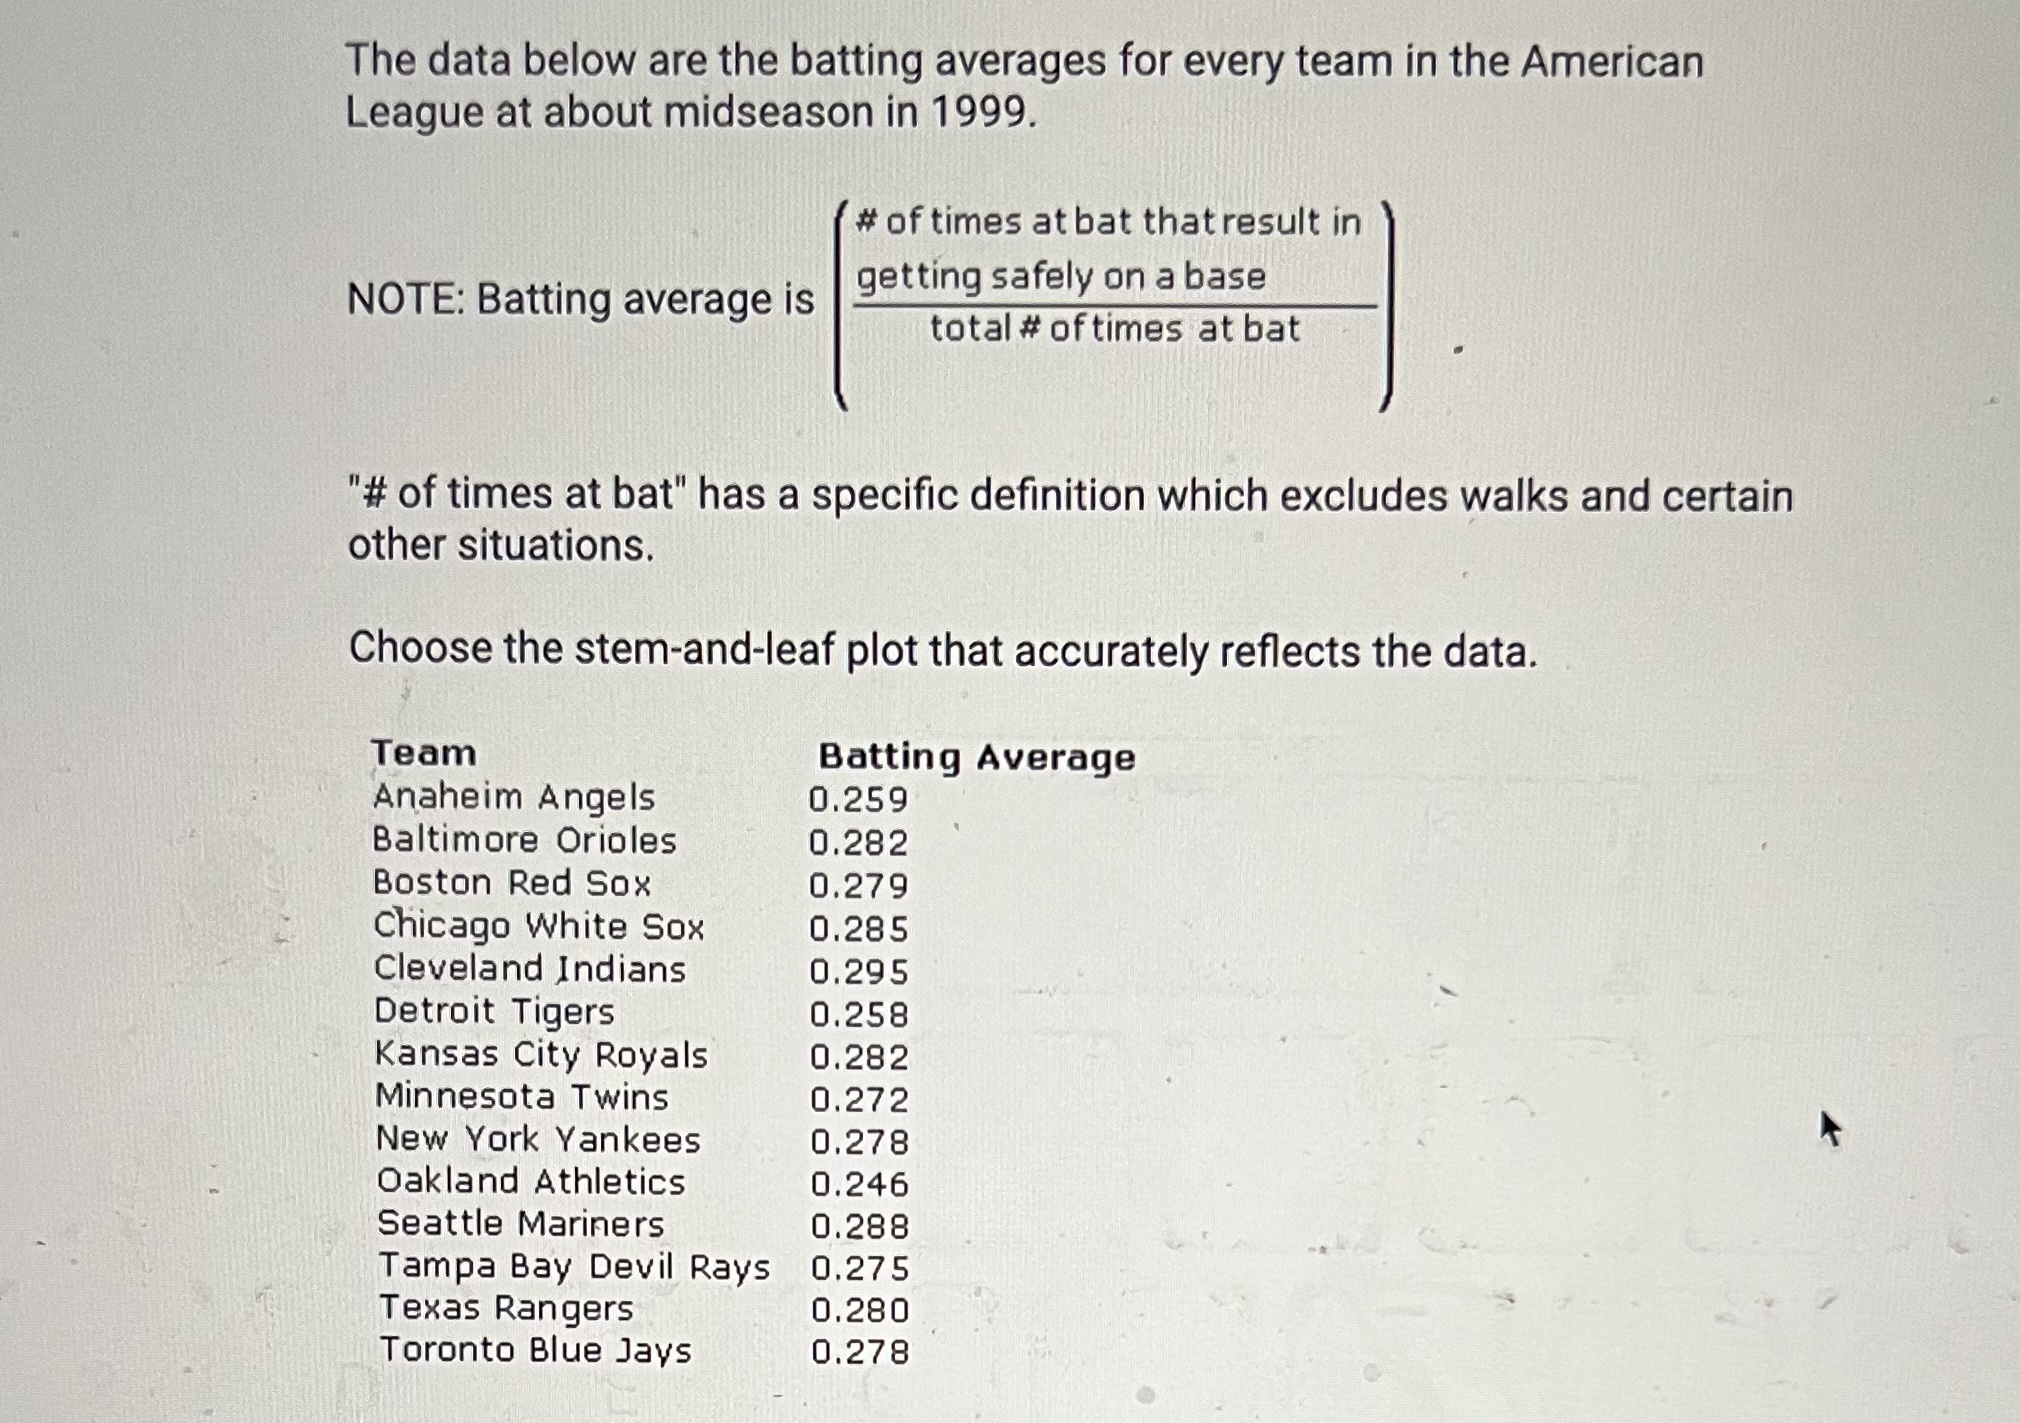


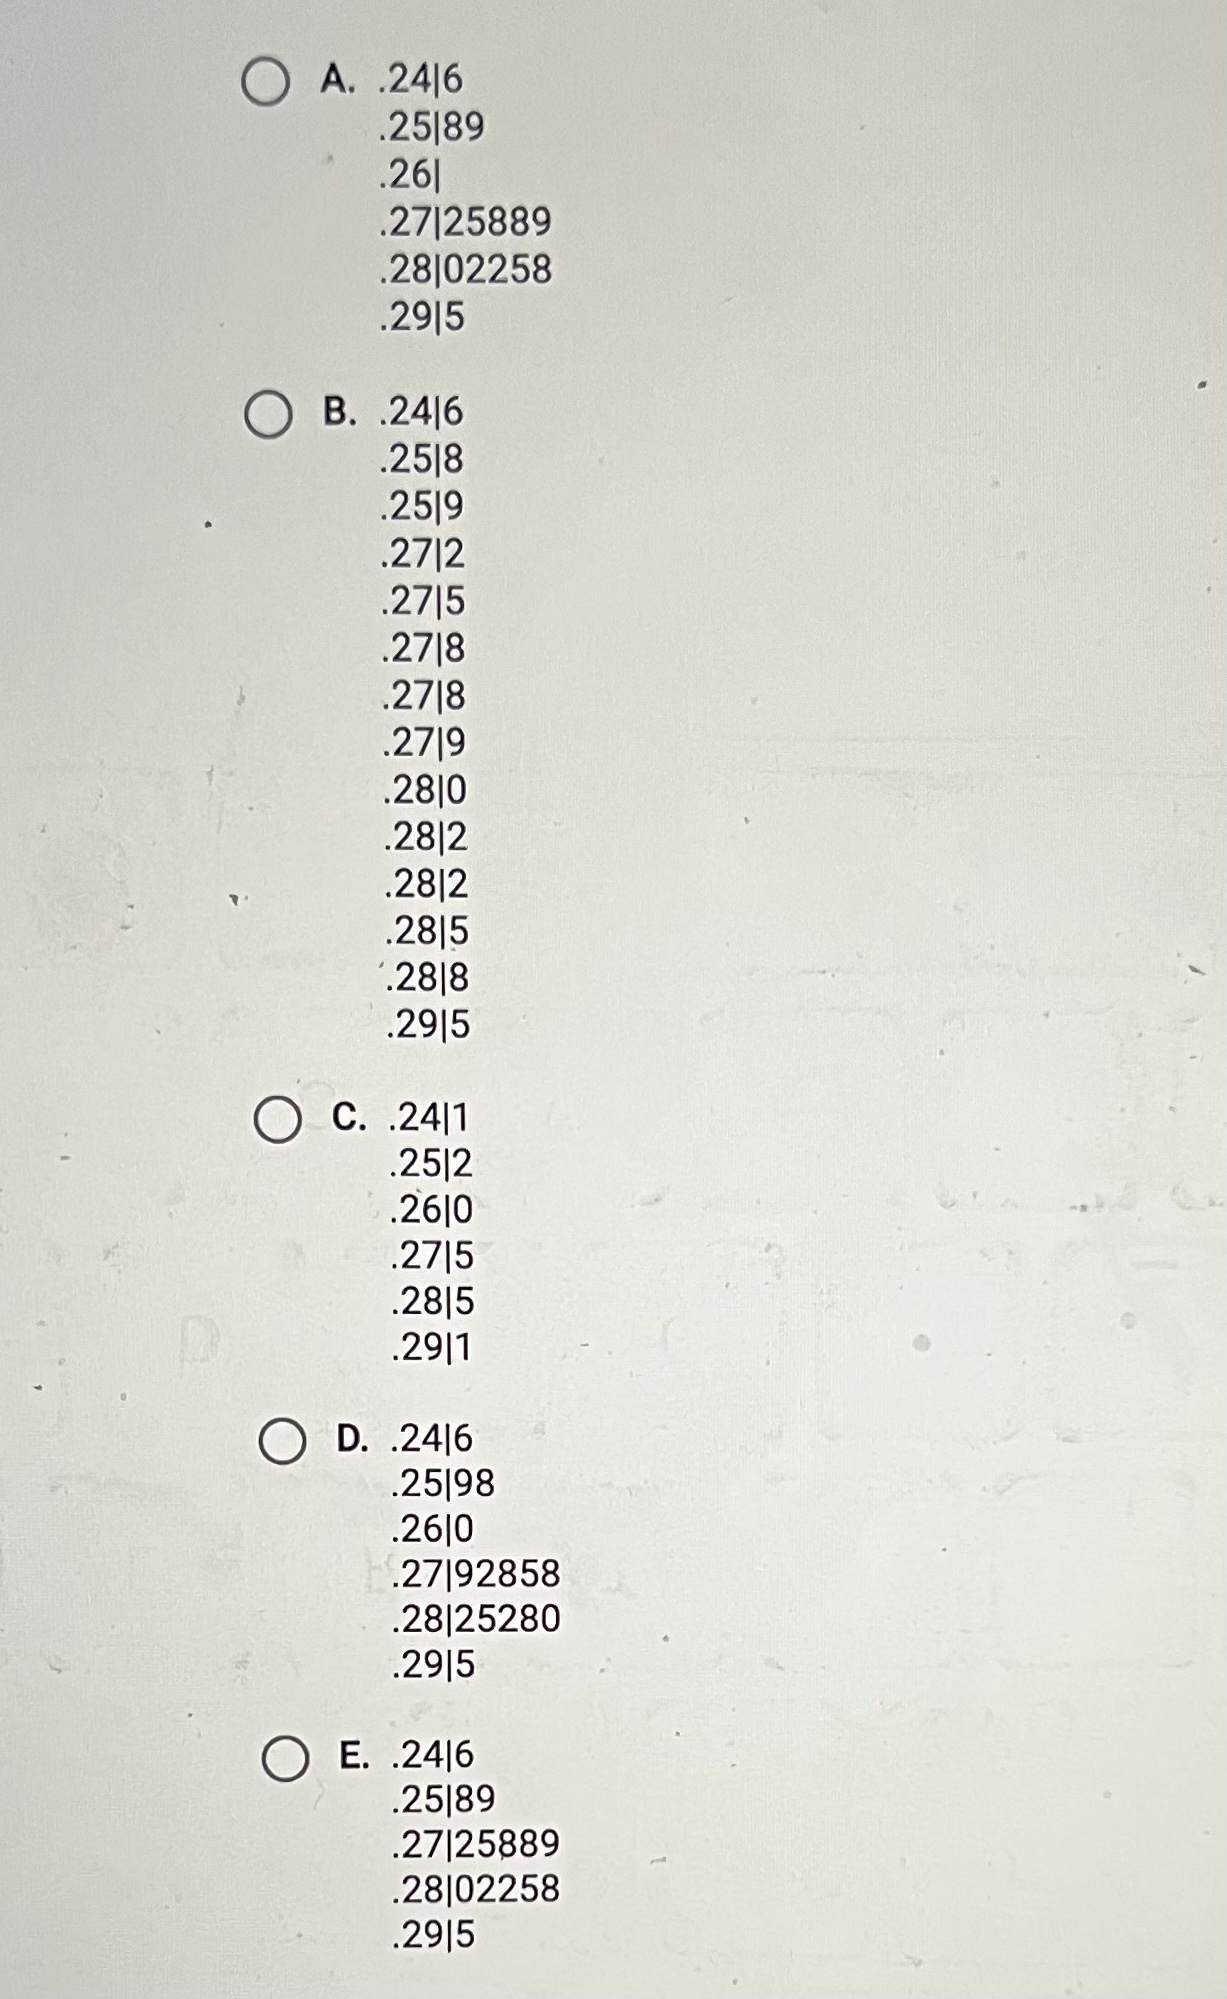
The data below are the batting averages for every team in the American League at about midseason in 1999. # of times at bat that result in NOTE: Batting average is getting safely on a base total # of times at bat "# of times at bat" has a specific definition which excludes walks and certain other situations. Choose the stem-and-leaf plot that accurately reflects the data. Team Batting Average Anaheim Angels 0.259 Baltimore Orioles 0.282 Boston Red Sox 0.279 Chicago White Sox 0.285 Cleveland Indians 0.295 Detroit Tigers 0.258 Kansas City Royals 0.282 Minnesota Twins 0.272 New York Yankees 0.278 Oakland Athletics 0.246 Seattle Mariners 0.288 Tampa Bay Devil Rays 0.275 Texas Rangers 0.280 Toronto Blue Jays 0.278O A. .2416 25189 .261 27125889 28|02258 2915 B. .2416 2518 .2519 2712 2715 2718 2718 .2719 .2810 2812 2812 28/5 .28 8 .2915 O C. .2411 2512 .2610 .2715 .28 5 2911 O D. .2416 25198 2610 .27192858 .28 25280 .2915 O E. .2416 25189 .27125889 28|02258 .2915
Step by Step Solution
There are 3 Steps involved in it

Get step-by-step solutions from verified subject matter experts