

Question: The data below includes the individuals who are identified by ID numbers i = 1,...,20) and their monthly wages in thousands), gender, education levels (years
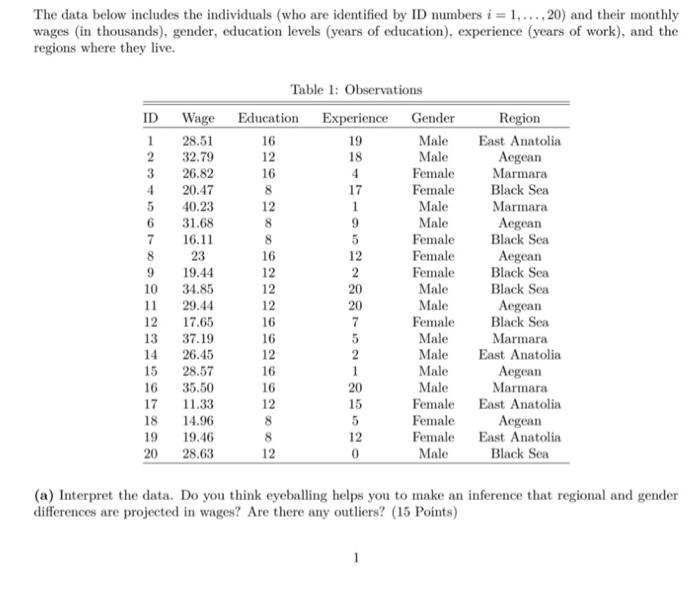
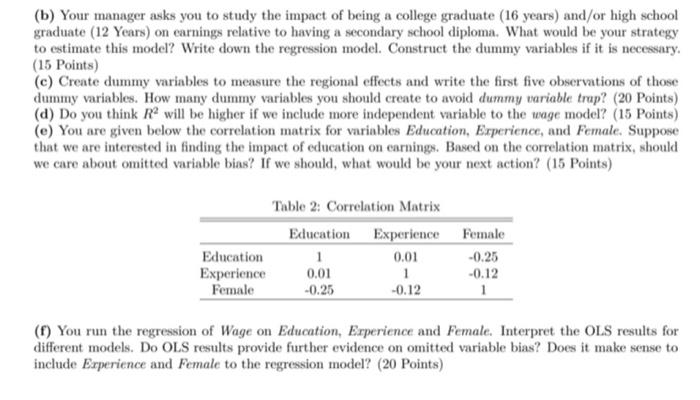
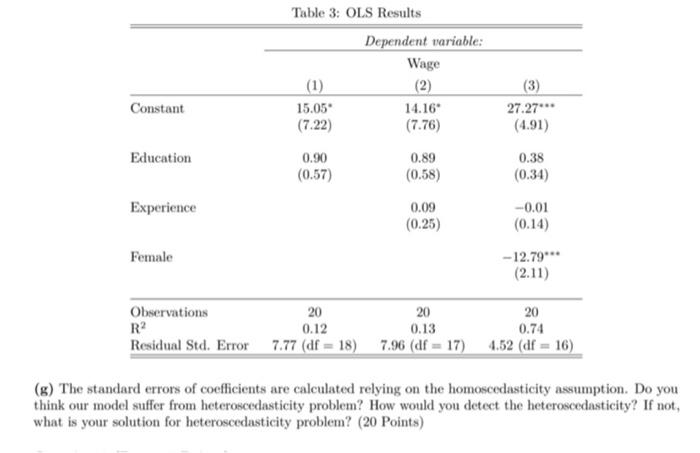
The data below includes the individuals who are identified by ID numbers i = 1,...,20) and their monthly wages in thousands), gender, education levels (years of education), experience (years of work), and the regions where they live. ID Wage 1 28.51 2 32.79 3 26.82 4 20.47 5 40.23 6 31.68 16.11 8 23 9 19.44 10 34.85 11 29.44 12 17.65 13 37.19 14 26.45 15 28.57 16 35.50 17 11.33 18 14.96 19 19.46 20 28.63 Table 1: Observations Education Experience Gender 16 19 Male 12 18 Male 16 4 Female 8 17 Female 12 1 Male 8 9 Male 8 5 Female 16 12 Female 12 2 Female 12 20 Male 12 20 Male 16 7 Female 16 5 Male 12 2 Male 16 1 Male 16 20 Male 12 15 Female 8 5 Female 8 Female 12 0 Male Region East Anatolia Aegean Marmara Black Sea Marmara Aegean Black Sea Aegean Black Sea Black Sea Aegean Black Sea Marmara East Anatolia Aegean Marmara East Anatolia Aegean East Anatolia Black Sea 12 (a) Interpret the data. Do you think eyeballing helps you to make an inference that regional and gender differences are projected in wages? Are there any outliers? (15 Points) 1 (b) Your manager asks you to study the impact of being a college graduate (16 years) and/or high school graduate (12 Years) on earnings relative to having a secondary school diploma. What would be your strategy to estimate this model? Write down the regression model. Construct the dummy variables if it is necessary (15 Points) (c) Create dummy variables to measure the regional effects and write the first five observations of those dummy variables. How many dummy variables you should create to avoid dummy variable trap? (20 Points) (d) Do you think will be higher if we include more independent variable to the wage model? (15 Points) (e) You are given below the correlation matrix for variables Education, Experience, and Female. Suppose that we are interested in finding the impact of education on earnings. Based on the correlation matrix, should we care about omitted variable bias? If we should, what would be your next action? (15 Points) Table 2: Correlation Matrix Education Experience Female Education 1 0.01 -0.25 Experience 0.01 1 -0.12 Female -0.25 -0.12 1 (1) You run the regression of Wage on Education, Experience and Female. Interpret the OLS results for different models. Do OLS results provide further evidence on omitted variable bias? Does it make sense to include Experience and Female to the regression model? (20 Points) Table 3: OLS Results Dependent variable: Wage (1) (2) 15.05 14.16 (7.22) (7.76) Constant (3) 27.27 (4.91) Education 0.90 (0.57) 0.89 (0.58) 0.38 (0.34) Experience 0.09 (0.25) -0.01 (0.14) Female -12.79 (2.11) Observations R? Residual Std. Error 20 20 0.12 0.13 7.77 (df = 18) 7.96 (df = 17) 20 0.74 4.52 (df - 16) (g) The standard errors of coefficients are calculated relying on the homoscedasticity assumption. Do you think our model suffer from heteroscedasticity problem? How would you detect the heteroscedasticity? If not, what is your solution for heteroscedasticity problem? (20 Points) The data below includes the individuals who are identified by ID numbers i = 1,...,20) and their monthly wages in thousands), gender, education levels (years of education), experience (years of work), and the regions where they live. ID Wage 1 28.51 2 32.79 3 26.82 4 20.47 5 40.23 6 31.68 16.11 8 23 9 19.44 10 34.85 11 29.44 12 17.65 13 37.19 14 26.45 15 28.57 16 35.50 17 11.33 18 14.96 19 19.46 20 28.63 Table 1: Observations Education Experience Gender 16 19 Male 12 18 Male 16 4 Female 8 17 Female 12 1 Male 8 9 Male 8 5 Female 16 12 Female 12 2 Female 12 20 Male 12 20 Male 16 7 Female 16 5 Male 12 2 Male 16 1 Male 16 20 Male 12 15 Female 8 5 Female 8 Female 12 0 Male Region East Anatolia Aegean Marmara Black Sea Marmara Aegean Black Sea Aegean Black Sea Black Sea Aegean Black Sea Marmara East Anatolia Aegean Marmara East Anatolia Aegean East Anatolia Black Sea 12 (a) Interpret the data. Do you think eyeballing helps you to make an inference that regional and gender differences are projected in wages? Are there any outliers? (15 Points) 1 (b) Your manager asks you to study the impact of being a college graduate (16 years) and/or high school graduate (12 Years) on earnings relative to having a secondary school diploma. What would be your strategy to estimate this model? Write down the regression model. Construct the dummy variables if it is necessary (15 Points) (c) Create dummy variables to measure the regional effects and write the first five observations of those dummy variables. How many dummy variables you should create to avoid dummy variable trap? (20 Points) (d) Do you think will be higher if we include more independent variable to the wage model? (15 Points) (e) You are given below the correlation matrix for variables Education, Experience, and Female. Suppose that we are interested in finding the impact of education on earnings. Based on the correlation matrix, should we care about omitted variable bias? If we should, what would be your next action? (15 Points) Table 2: Correlation Matrix Education Experience Female Education 1 0.01 -0.25 Experience 0.01 1 -0.12 Female -0.25 -0.12 1 (1) You run the regression of Wage on Education, Experience and Female. Interpret the OLS results for different models. Do OLS results provide further evidence on omitted variable bias? Does it make sense to include Experience and Female to the regression model? (20 Points) Table 3: OLS Results Dependent variable: Wage (1) (2) 15.05 14.16 (7.22) (7.76) Constant (3) 27.27 (4.91) Education 0.90 (0.57) 0.89 (0.58) 0.38 (0.34) Experience 0.09 (0.25) -0.01 (0.14) Female -12.79 (2.11) Observations R? Residual Std. Error 20 20 0.12 0.13 7.77 (df = 18) 7.96 (df = 17) 20 0.74 4.52 (df - 16) (g) The standard errors of coefficients are calculated relying on the homoscedasticity assumption. Do you think our model suffer from heteroscedasticity problem? How would you detect the heteroscedasticity? If not, what is your solution for heteroscedasticity problem? (20 Points)
Step by Step Solution
There are 3 Steps involved in it

Get step-by-step solutions from verified subject matter experts